Hypsographic curve

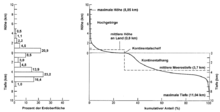
A hypsographic curve (also hypsographic curve , synonymous hypsometric curve , from ancient Greek ὕψος: height, hill) illustrates the distribution of the various altitude levels of a geographic area, such as that of an earth-like planet or special regions such as rivers , inland lakes and inland seas .
Differential and cumulative hypsographic curve
In the case of a differential hypsographic curve, the height is usually plotted on the abscissa (horizontal axis), while the ordinate (vertical axis) shows the percentage of the altitude in relation to the total area. Instead of a curve, it is also possible to display it in the form of a bar or column diagram (see figure above, left-hand part).
In the case of a cumulative hypsographic curve, the proportion of the total area is plotted cumulatively up to one hundred percent on the abscissa and the altitude is plotted on the ordinate (see figure above, right part). The percentiles of the height distribution can be read from this curve .
Examples
earth
The differential hypsographic curve of the earth has two peaks: one at the mean level of the continents and one at the mean level of the ocean floor . This dichotomy is therefore a clear sign of the existence of water in the form of large oceans.
The cumulative hypsographic curve of the earth shows approximately two height levels: the continental platform in the area of about 100 meters and the deep sea . Compared to these large areas, the extremes of the high mountains and deep-sea trenches make relatively little difference. In contrast, the curve clearly shows a transition between the two main levels of continental plains and deep-sea floors - the slope of the continental shelf . A total of 29% of the earth's surface is above sea level, i.e. it is land, of which less than 10 percent are mountains with an altitude of more than 1000 m. On the other hand, about 50% of the earth's surface is below −2000 m, and only 2% is deeper than −6000 m.
Switzerland
The cumulative hypsographic curve for Switzerland shown in this section shows , for example, that less than 20% of the country's area is below 500 m above sea level.
Venus
The differential hypsographic curve of Venus has only a single sharp peak. This is a clear sign that there never were oceans and associated plate tectonics on Venus .
The cumulative hypsographic curve of Venus, unlike that of Earth, has only one platform instead of two.
Mars
The differential hypsographic curve of Mars has two peaks, relatively similar to that of Earth.
The cumulative hypsographic curve of Mars shows, relatively similar to Earth, two contrasting levels, which, however, are not connected by a slope.
See also
Web links
- Lexicon of geography: hypsographic curve. Spektrum.de
- Geosciences Lexicon: Hypsographic Curve. Spektrum.de
Individual evidence
- ↑ a b c W. Luo, PR Stoddard: Comparative hypsometric analysis of Earth, Venus and Mars: Evidence for extraterrestrial plate tectonics? Lunar and Planetary Science XXXIII (2002), 1512.pdf
- ^ Paul R. Stoddard, Donna M. Jurdy: Topographic comparisons of uplift features on Venus and Earth: Implications for Venus tectonics. Icarus 217 (2012) 525 (PDF)
