Commodity index
A commodity index is a stock exchange index in a commodity market, i.e. a key figure that indicates price changes on the commodity market or individual segments of the commodity market.
concept
The key figure traces the price development of selected raw materials in a hypothetical portfolio and is intended to representatively document the development in this sub-market of global financial events. The starting point for calculating a raw material index is a defined base period. The changes in the index over time reflect the performance ( performance ) of the portfolio again. Different indices differ in the weighting of the raw materials, the rollover strategies and the rules for changing the index composition. Commodity indices can form the basis for derivatives .
The components in a raw material index can be roughly divided into the following categories:
- Energy resources
- Fossil fuels
- Fuels
- Metals
- Industrial metals
- Precious metals
- Agriculture
- Agricultural commodities
- Cattle farming
Versions
Spot Return Index
The Spot Return Index always shows the current commodity price in its next delivery month. On expiry, the calculation is switched over to the next future contract, whereby the price difference between the two contracts is not taken into account. Contango and backwardation are therefore not taken into account when calculating the index.
Excess return index
The excess return index continuously rolls the raw material from the current delivery month into the next delivery month. Contango and backwardation are included in the calculation of the index, in contrast to the spot return index. Interest income in this index is not taken into account. The excess return index is similar to a price index.
Total return index
The total return index also continuously rolls the raw material from the current delivery month into the next delivery month. Contango and backwardation are also included in the calculation of the index. In contrast to the excess return index, the total return index also contains interest income and is therefore more similar to a performance index. When buying a commodity future, the full value of the contract does not have to be deposited on the futures exchange, but only a small part, the so-called margin . This also applies to the operators of commodity indices, who invest the remaining capital in short-dated US government bonds. The resulting interest income flows into the calculation of the total return index.
Inflation indicator
A commodity index is considered an indicator of the future development of inflation or the development of costs in the industry. In the event of a trend reversal on the commodities market , it is a good leading indicator for the bond market , as commodities generally have a lead of three to six months compared to bonds . There is also a close temporal connection between bond interest rates and commodity prices.
Relationships between commodity indices with the geometrically weighted US dollar index and the trade-weighted Trade Weighted US dollar index can be identified. A falling US dollar is synonymous with inflationary tendencies and rising raw material prices. This is especially true for agricultural commodities and the price of oil .
For Europeans it is exactly the opposite. A strong US dollar leads to a weak euro (see Euro Effective Exchange Rate Index ). In terms of the links between the markets, this means that raw material prices and euros are synchronized. Numerous currencies are relatively dependent on the development of raw material prices. For example, the Canadian dollar has a close correlation with commodity indices. The currency tends to rise along with the index.
There is a connection between freight rates and raw material prices and the demand for metals, fuels and food. There is a certain synchronization between the development of commodity indices and the Baltic Dry Index (BDI). The BDI is published by the Baltic Exchange in London and is an important price index for the worldwide shipping of major cargo (mainly coal, iron ore and grain) on standard routes.
Indices
Commodity indices
The oldest regularly published commodity index is the Commodity Price Index from The Economist magazine . It was first published in 1864 and counted back to 1845. The original base value was 100 points and the base period from 1845 to 1850. Since a revision in 2005, the index has included 25 commodities from the food (56.4 percent) and industrial raw materials (43.6 percent) sectors. Oil and precious metals are not included.
The S&P GSCI index (formerly Goldman Sachs Commodity Index), which was launched in 1991 and taken over by Standard & Poor's in 2007, is better known, albeit heavily energy-heavy . It contains 24 raw materials with a weighting that is adjusted annually according to their global production volume: 63% energy (oil and gas), 16% agricultural products (wheat, corn, soybeans, coffee, sugar, cocoa, cotton), 9% industrial metals (alumnium , Copper, lead, nickel, zinc), 8% cattle and 4% precious metals (gold and silver).
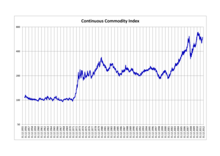
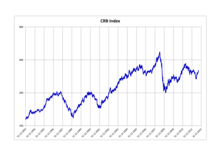
The Thomson Reuters CRB index , which was first calculated in 1957 by the Commodity Research Bureau (CRB) in the USA, is less oil-heavy . It currently measures the price development of 19 raw materials with a weighting that is capped for individual raw material groups: 39% energy (oil, gas), 34% agricultural products (wheat, corn, soybeans, coffee, sugar, cocoa, cotton, orange juice), 20 % Metals (gold, silver, aluminum, copper) and 7% cattle. The calculation was revised so fundamentally in 2005 that the current index cannot be compared with the historical CRB index. The original CRB index has since continued under the name Continuous Commodity Index ("Old CRB Index").
Other commodity indices are the Bloomberg Commodity Index (formerly Dow Jones) and the Rogers International Commodity Index (RICI). A food - price index of the Food and Agriculture Organization (FAO) of the United Nations , the FAO Food Price Index (FFPI). It records the development of world market prices for various agricultural raw materials and foods.
The following table gives an overview of the most popular commodity indices.
| Surname | Abbreviation | introduction | Historical data since |
Number of raw materials (2010) |
Change in% (2000-2010) |
|---|---|---|---|---|---|
| Bloomberg Commodity Index | BCOM | 1998 | 1991 | 19th | 41.7 |
| Continuous Commodity Index | CCI | 1957 | 1956 | 17th | 176.3 |
| CRB index | CRB | 2005 | 1994 | 19th | 69.9 |
| Rogers International Commodity Index | RICI | 1998 | 1998 | 38 | 141.3 |
| S&P GSCI | S&P GSCI | 1991 | 1970 | 24 | 155.9 |
Commodity stock indices
In contrast to commodity indices, commodity stock indices do not reflect the performance of the commodities but that of the stock corporations. Examples are the NYSE Arca Gold BUGS Index (HUI), a stock index of international gold producers and mainly gold mining companies , and the Philadelphia Gold and Silver Index (XAU), in which international gold and silver producers are listed.
The XAU represents a portfolio of hedged and unhedged mining companies whose production is secured both with and with forward sales. This is a major difference to the HUI, which only contains stocks of gold producers who do not make forward sales.
Individual evidence
- ↑ Deutsche Bank: Guide to Commodity Indices ( Memento of the original dated January 30, 2012 in the Internet Archive ) Info: The archive link was inserted automatically and has not yet been checked. Please check the original and archive link according to the instructions and then remove this notice.
- ↑ Deutsche Bank: Commodity Investments - An Exciting Asset Class
- ↑ Sentix: Technical Intermarket Analysis ( Memento from December 16, 2005 in the Internet Archive )
- ↑ Frankfurter Allgemeine Zeitung: Decline in the Baltic Dry Index is not a good signal for the global economy , from July 6, 2010
- ^ The Economist's commodity-price index . 160 years on. In: The Economist . February 10, 2005, ISSN 0013-0613 ( economist.com [accessed April 14, 2017]).
- ^ The Economist commodity-price index . In: The Economist . January 28, 2017, ISSN 0013-0613 ( economist.com [accessed April 14, 2017]).
- ^ S&P Dow Jones Indices: Index Methodology, November 2016.
- ↑ Thomson Reuters / CoreCommodity - CRB Index. Thomson Reuters, April 4, 2017, accessed April 14, 2017 .
- ↑ Wikiposit: Historical prices of the CCI and S&P GSCI
- ^ Yahoo: Historical prices of the DJ-UBSCI
- ↑ Rogers Raw Materials: Historical Prices of the RICI
- ↑ Stooq: Historical Prices of TRJ / CRB


