System archetype
System archetype is a term created by the American Peter M. Senge for the systemic description and representation of generic structures of frequently observable behavior patterns of people. As a pattern illustrated in this way, they should make the respective underlying dynamics generally understandable and, through the learning effect, predictable possible consequences of certain actions. In particular, the self-dynamics of the behavior pattern should be comprehensible in order to be able to avoid undesirable or unintended effects of one's own actions.
The system archetypes are designed as easily understandable models for system analysis . Even if Senge is primarily concerned with the application on the level of management and participatory corporate design , the popular scientific literature (e.g. O'Connor / McDermott) uses numerous examples to show how the system archetypes can be transferred to everyday interaction phenomena in different contexts.
Conceptual derivation / intention
In the literature it is not clear whether Senge was inspired by the original philosophical sense or by the depth psychological meaning when he used the term archetype . But since he is concerned with the provision of simple aids with which we can become aware of previously unconscious behavior patterns , a certain reference to the psychological term is obvious. There is a clear difference: Senge is not concerned with the exploration of complex psychological depth structures, but with awareness work on our mental models .
In this respect, Senge's work falls into the field of systemic counseling , with the aim of questioning existing beliefs, expectations and values . Since our judgments are mostly based on a selective perception , they are often characterized by distortions and generalizations: Appropriate views are reinforced, unsuitable ones are weakened ( cognitive dissonance ) ; Getting used to it and time pressure lead to generalizations (“It has always been like that!”… “Everyone does it like that!”) . System archetypes are designed to help overcome these patterns by finding simple and effective levers to solve them.
Basic structure
All system archetypes developed so far are based on various combinations of the two elementary feedback loops from systems theory ; Senge calls reinforcing (reinforcing) and balancing (balancing) feedback. Constant aids for understanding the cycles are the illustration of time delays and influencing limiting factors.
Typology
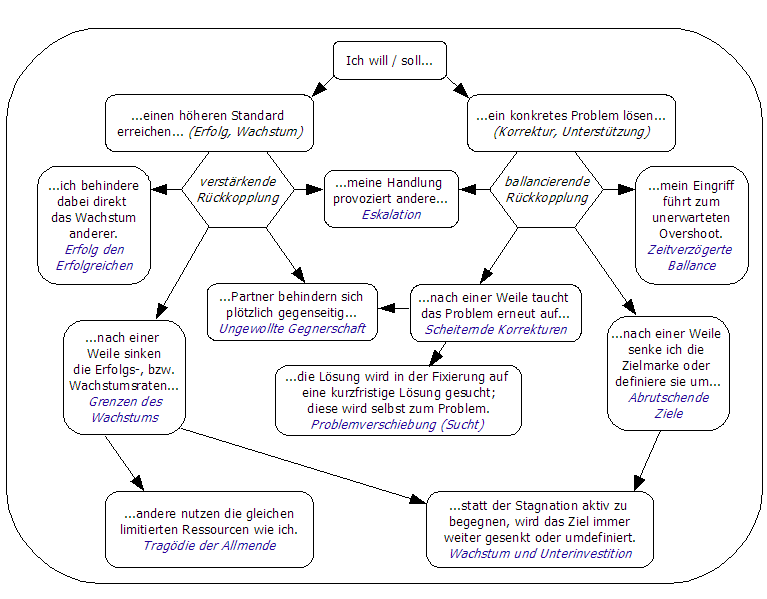
The following ten system archetypes are the best-documented generic structures. Before a particular difficult situation can be dealt with using this analysis technique, the corresponding effective pattern must be identified. The following flowchart should help you find them. The links shown are intended as a guide; there may be other subtle links in the situation being analyzed. In system theory, this is always possible. For reasons of clarity, they are not shown here.
Delayed balance
(orig .: Balancing process with delay), further translations: Equilibrium process with time delay
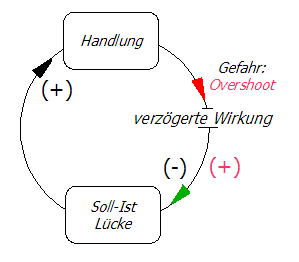
Structure: This is a balancing feedback, whereby a desired state (level) is only reached with a time delay, comparable to an amortization phase. The graphic shows such a control loop and what happens if the delay is ignored.
Dynamics: We often ask ourselves: "Why is nothing happening here, even though I am doing what is apparently the right thing?" . The duration of a time delay is then perceived as annoying; the lack of desired state is interpreted as insufficient self-action. This can lead to the action being amplified unnecessarily and ultimately overshooting the target, creating an unwanted reinforcing feedback (overshoot) .
Examples:
- In order to meet the increasing demand for a product, production capacities are increased. When the increased production has started after some time, the demand has already fallen again and there is an oversupply.
- A shower takes some time to get hot. The hot water tap is turned on more and more because the water is cold at the beginning. Finally, boiling water comes out of the shower.
Solution: The duration of the delay can be better estimated by understanding the influencing factors (ongoing market information, technical relationships). This in turn enables more careful dosing of one's own (re) actions.
escalation
(orig .: Escalation)
Structure: This pattern is created by an ominous combination of two self-balancing feedbacks. In their overall effect they grow together to form a reinforcing feedback because the overall balance is permanently disturbed. This is reminiscent of the desperate statement: "Only when the others stop can I stop too!"
The graph shows from A's perspective (clockwise) that his success immediately reinforces B's actions, which in turn reduces A's relative success in turn; from the perspective of B a restoration of balance (green arrow top right) . Through the upstream evaluation of the relative success, the internal balancing feedback on A's own actions (green arrow, bottom left) is converted into reinforcing feedback, which also escalates B's actions (red arrows below) . The overall pattern can be read as a (theoretical) endless loop of a lying eight (∞).
Dynamics: In the event of escalation, two competitors strive from a purely subjective point of view to achieve a more dominant position than the other. The assessment that a (re) action of the other has led to their lead is perceived as threatening the balance. The own (re) action aims at an apparent restoration of the balance, which in turn is perceived by the other side as a provocative disruption. The isolated, purely subjective perspective of both sides prevents an actual balance or the perception of such. If the pattern remains unsolved (see solution) , it will eventually be torn off by force or by the lack of limiting resources ("I won't give in first!", "It's too late to stop!") .
Examples:
- A price war between companies, which leads to the fact that the competitors keep lowering their prices and thus reducing their profits.
- An arms race that devours more and more resources from those involved.
Solution: The escalation can only be ended prematurely if both sides adopt a neutral perspective and agree on a joint future-oriented strategy. Subjective assessments of an imbalance can thereby be overcome.
Success the successful
(orig .: Success to the successful)
Structure: This is the combination of two cycles that can balance themselves on their own. Only when they are linked does the pattern of reinforcing feedback arise in both cycles, but with the opposite sign. This contrary course results from a predetermined imbalance in the starting conditions; the connection point is a limiting factor that is unilaterally directed from the outside. From another perspective, this pattern could also be called failure the unsuccessful .
The graph shows how A becomes more and more successful by giving preference "by itself" (green arrows) ; at the same time, B becomes increasingly unsuccessful. Overall, mutual success and failure reinforce one another (red arrows) .
Dynamics: Two competitors compete for limited support or resources. If one of the two receives more of the limited support / resources, he can develop a lead that apparently can no longer be taken from him. This means that the second person receives less support / resources (see zero-sum game ). With more resources, the first competitor becomes even more successful and receives even more resources, while the second receives even less. In this way, the first preferred becomes more and more successful. In psychology, this is often referred to as a "self-fulfilling prophecy" as soon as those concerned attribute this systemic pattern to their own qualities.
Examples:
- A company's two products compete for financial and managerial resources. A product immediately proves to be a hit and thus attracts further resources.
- Students who are more active from the start get more attention from teachers than quieter students.
- State schools in England receive funding from local authorities based on the number of students. A school with a higher number of students gets more money and can thus offer a better learning environment. As a result, more students register there and the school receives even more money.
Solution: A resolution of this one-sided tragic pattern can be achieved either on the macro level by a fair regulation of the limiting factor, or by mobilizing own resources on the disadvantaged side, such as creativity and empowerment .
Limits to growth
(orig .: Limits to growth)
Structure: With this classic system archetype, an intensifying cycle is coupled with a certain time delay to a balancing cycle. Only then is the pattern effective as such. Limiting resources are responsible for the time lag, which generate steadily decreasing growth rates ( logistic growth ) .
In the graphic, the delayed coupling of the limiting resource is illustrated by the red arrow .
Dynamics: The strengthening cycle is gradually nourished until a coupled limiting factor (= used resource) adds a balancing cycle. As long as the corresponding resource is not used up, the balancing cycle remains open (= decoupled) and therefore ineffective. However, as soon as the usage limit is reached, the other cycle can no longer be strengthened; any further use of energy fizzles out, as if the accelerator pedal and brake were pressed at the same time ("I have the feeling that I am stepping on the spot!") .
Examples:
- The economic growth of a country increases until at least one of the resources required for it can no longer be regenerated at the same rate. Limiting resources limit growth. In quantitative terms, this can be represented by long-term decreasing growth rates.
- A student makes steady progress with a certain learning method until the additional successes (= learning growth rates) decrease measurably. In this case, the limiting resource is the amount of learning that can be achieved in a certain period of time. Decreasing growth rates can be demonstrated using the quotient of the learning workload per unit of time; the student cannot learn more with this method during this period.
Solution: Proactive budgeting with limited resources, i.e. an efficiency strategy, is only a sham solution, because over time these are also used up if their regeneration times are ignored. A more effective solution is to include or switch to renewable resources with a simultaneous long-term strategy that allows for a fluctuation around the optimal level of saturation. For the student this means learning not just once and intensively, but several times and extensively in order to maintain constant growth rates.
Problem shift
(orig .: Shifting the Burden)
Structure: This is first a short-term balancing with a long-term combined balancing circuit. This structure changes in the course of the dynamics; the long-term balancing cycle is bridged, a combination of a short-term balancing and a strengthening cycle occurs.
Dynamics: If the actual cause of a problem is not recognized or ignored, short-term effective (= symptomatic) solutions are used. By constantly giving preference to this short-term balancing cycle, the path to a long-term effective solution is bridged. Cumulative side effects on this side path create a new problem, with the original problem becoming less and less important; a problem shift arises. This leads to the structural change mentioned above; the short-term balancing cycle is now coupled with an intensifying cycle that allows the new problem to dominate.
This momentum reflects the development and maintenance of an addiction . The unsolved original problem is continually treated symptomatically until it finally becomes less important; now addiction as an intensifying feedback is the dominant problem.
Example:
- A student fails to reduce learning stress through relaxation techniques. In order to calm down in the short term, she starts smoking (= symptomatic solution). Over time, she reaches her limit earlier and earlier, and therefore smokes more and more often (= reinforcement). With the new problem of 'nicotine addiction' she gradually loses her natural ability to relax.
Solution: Through conscious regular self-observation, short-term actions can be exposed as symptomatic sham solutions. Background information and a practiced time management enable strategies and freedom to find a long-term effective solution.
Failing fixes
(orig .: Fixes that fail), further translations: incorrect corrections
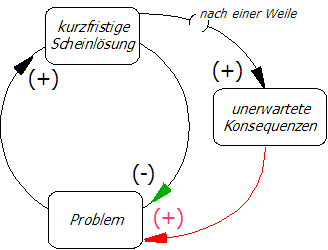
Structure: Here a short-term balancing cycle turns into a strengthening cycle with a time delay. This change is the result of unexpected consequences that arise after a while with an unsuitable problem-solving strategy.
Dynamics: Similar to the shifting of problems , a sham solution is used (= short-term balancing cycle). However, with this pattern the focus remains on the problem to be solved. And instead of creating another problem, the lack of effective problem solving leads to an unexpected worsening of the existing problem with a time delay. Only this change to an intensifying cycle reveals the previous intervention as "failed corrections".
Example:
- A line-related, occasionally occurring electrical short circuit is not recognized as such by a layperson. The first few times he uses the same fuse again. As the failure intervals shorten, a stronger fuse is used. The line overheats with a time delay because it is not designed for the current strength permitted. The increasing feedback can now manifest itself in the form of a dangerous cable fire.
Solution: Only thorough troubleshooting can avoid this pattern. Unchanged problems after repeated interventions are an indication of a sham solution.
Slipping targets
(orig .: Eroding Goals), further translations: Eroding / Drifting goals , goal softening
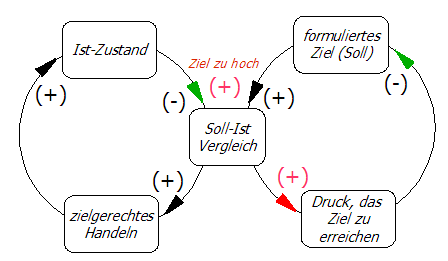
Structure: Here two balancing cycles are linked to one another via a target / actual comparison; one is regulated by action , the other regulated by expectations . Action results and objectives are compared.
Dynamics: A desired goal (= expectation) initially leads to corresponding actions. At the same time, there is latent pressure to achieve the goal. If the actions are not successful in a reasonable time, the pressure increases (red arrow). External or internal circumstances can lead to either lowering or redefining the goal, which in practice amounts to the same thing; the target slips. As long as the opportunity exists, it is better to lower targets than to increase efforts to achieve the goal after all.
Examples:
- In order to bring a potentially toxic product that has been manufactured with high capital expenditure on the market profitably, the limit values above which it is considered to be questionable are lowered (instead of avoiding toxins from the outset).
- In order to meet debt-dependent criteria, a state redefines its debt by outsourcing the questionable part of it from the calculation. The redefinition therefore led to a reduction.
Solution: There can be good reasons for lowering goals, for example if they were unrealistic due to a lack of experience. However, if a goal is deliberately lowered or redefined even though it could be achieved, the structures that created the pressure in this direction must be criticized.
Unwanted opposition
(orig .: Accidental Adversaries)
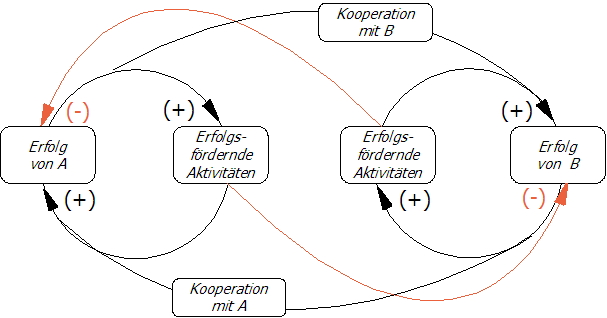
Structure: This pattern consists of three reinforcing and two balancing circuits. It illustrates the seemingly paradoxical problem of mutual inhibition when cooperation is too close.
Dynamics: The comprehensive 'global' cycle represents the mutual cooperation of A and B, the small 'local' cycles the self-referential increases in success (black arrows). The close cooperation leads to an unwanted mutual inhibition due to the collision with one's own goals (red arrows).
Example: Two companies in the same sector decide to work together as partners in order to be able to act successfully together. If they are too close to one another in relation to the market, the dependence on common resources (customers, materials ...) will lead to the partner's own success-promoting activities in turn inhibiting the success of the partner. The partnership turns into 'unwanted opposition'.
Solution: A cooperative success strategy of companies in the same branch is only possible if the principles of market observation are met. Either they should be spatially further apart, or the similar products are manufactured with different resources or for different customer groups.
Tragedy of the commons
(orig .: Tragedy of the Commons), further translations Tragedy of the commons, tragic of the commons
A commons is that part of the community's assets that can be used by all community members, such as green spaces, forests or lakes. The special case of unregulated use is economically referred to as the tragedy of the commons , because it can then be used more than it makes economic sense. At the same time, the ecological load-bearing capacity can be overstrained. The system archetype aims to clarify the feedback processes in this special case.
Structure: This is a matter of two reinforcing cycles that are initially independent of one another, which, in the event of the simultaneous use of a limiting resource, are coupled with one another and converted into balancing cycles. Users A and B shown in the graph can be defined variably in terms of their quantity, but taken individually, they are always below the critical size.
Dynamics: The feedback dynamics are very similar to the 'limits of growth' (see above) . However, there are clear differences in the intensity and repeatability of the pattern in relation to the same situation. While with the 'limits of growth' a limiting resource is continuously exploited until it is no longer available in the long term , with the common land problem the limiting resource is only exploited rhythmically , which means that it is only temporarily unavailable. In addition, the 'limits of growth' can be reached by individuals, while the common land problem only occurs when the number of users is overly critical.
Example:
- Some people regularly bathe in their favorite little lake regardless of the weather. As long as only a few share the same lake, everyone benefits from it (relaxation, rest, ...) . On beautiful summer days there is now rhythmic, short-term overcrowding. The benefit for everyone decreases rapidly; relaxation and rest become tension and noise. In addition, the ecological load-bearing capacity (self-cleaning power) of the lake could be exceeded in the long term if there is corresponding pollution . As soon as the critical number of users is not reached, the benefit for the individual increases again. The lake can also regenerate itself.
Solution: Common goods obtain their cooperative use for the community through adapted usage agreements or regulations; depending on who provides the commons.
Growth and underinvestment
(orig .: Growth and Underinvestment)
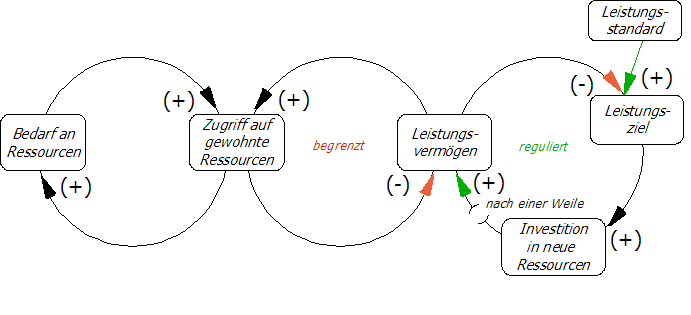
Structure: This system archetype consists of the series coupling of a reinforcing cycle with two balancing cycles. It shows the connection between two of the patterns shown above: The Limits to Growth and the Slipping Targets . The dynamic solution to the problem is already integrated in the overall pattern shown here (right cycle). That is why the solution is described here first, and then illustrated with an example.
Dynamics: The two cycles on the left show how the limited use of accustomed resources limit one's own performance in the long term (red arrow below). The third cycle on the far right shows that this also leads to a reduction in possible performance targets (red arrow above). So much for the problem of growth and underinvestment .
Example:
- A company that relies on years of use of familiar resources will eventually reach a performance limit. This view also leads to the lowering of higher goals. However, performance can be effectively increased by investing in new resources. However, this investment must be made in good time so that the newly developed resources become accustomed after a while, i.e. H. reliable resources.
Solution: If your own performance is compared with an external higher performance standard, there is pressure to invest in new resources in order to increase performance (green arrow above). If this investment is made in time, the new resources can turn into familiar resources over time, resulting in a dynamically regulated increase in one's own performance (green arrow below).
literature
- ↑ SENGE, PM: The Fifth Discipline. Art and Practice of the Learning Organization . Klett-Cotta 2006, ISBN 3-608-91379-3
- ↑ O'CONNOR J. and McDERMOTT, I .: The solution is lurking everywhere. Understand and use systemic thinking . VAK 2006, ISBN 3-932098-29-3
Web links
- Diploma thesis with some examples (PDF file; 1.43 MB)
- Guretzky: System Archetype (2010) , in the context of corporate and knowledge culture
- System archetypes in Beatz Biblionetz
