
table

A table (from the Latin tabella literally for "[the] tablet" and also translated "[the] tablet") is an orderly compilation of texts or dates . The content to be displayed is divided into rows ( horizontally ) and columns ( vertically ), which are graphically aligned with one another. The first column of a table is called the front column if it describes or explains the contents of the fields in the other columns in the same row. The first lines of a table, which contain explanations of the table content and / or designate or explain the fields in the following lines of the individual columns, form the table header ; if this consists of only one line, this is called the header . Tables also consist of table fields ( cells ). The reference to a field is the addressing ( reference )
Usually there is a semantic relationship between the content of a cell and the row or column in which it is located.
- In the case of relational databases , the term table stands for a collection of similarly structured data, which are technically mostly stored together (see under database table ).
- A spreadsheet is a computer program that is particularly suitable for displaying and calculating hypothetical numerical data on a large scale.
- In propositional logic, there are truth tables that clearly represent various operations and their possible results.
Well-known tables are, for example, the Düsseldorf table and the periodic table .
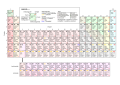
Periodic table

Table of endangered species

Data table

Schedule table

Saturn Oppositions

HTML table
_EN.svg)


Data tables
construction
| Eye color | |||||
|---|---|---|---|---|---|
| Hair color | brown | blue | Gray | green | total |
| brown | 119 | 84 | 54 | 29 | 286 |
| Blond | 7th | 94 | 10 | 16 | 127 |
| black | 68 | 20th | 15th | 5 | 108 |
| red | 26th | 17th | 14th | 14th | 71 |
| total | 220 | 215 | 93 | 64 | 592 |
| Eye color | |||||
|---|---|---|---|---|---|
| Hair color | brown | blue | Gray | green | total |
| brown | 42% | 29% | 19% | 10% | 100% |
| Blond | 5% | 74% | 8th % | 13% | 100% |
| black | 63% | 18% | 14% | 5% | 100% |
| red | 36% | 24% | 20% | 20% | 100% |
| total | 37% | 36% | 16% | 11% | 100% |
The aim of the tables is to provide a brief and concise overview of detailed information. In order to be able to take the relevant information from tables, an appropriate structure or design is necessary. Therefore, some rules should be observed for better readability:
- Tables should have explanatory text in a heading or a signature.
Because readers may just read the table, and then the most important information should be in the heading or signature. In addition, with an automatic (dynamic) layout, a table is moved to the next page after the descriptive text for reasons of space, and additional information is also important then. - For documents with several tables, table headings or the legend should contain their own identifier, e.g. numbering.
- Then you can clearly refer to a specific table in the accompanying text.
- A table should also be described in the accompanying text.
A table is often not easy to read, so the accompanying text should refer to the important statements in the table. Readers who are not familiar with the subject matter dealt with would otherwise not be able to understand the information in the table. - A table shouldn't have too many columns and rows.
The psychologist George A. Miller demonstrated in 1956 that one can only remember "information" in short-term memory . Therefore, it gives as a guide to the number of columns and rows in each case . - Rows and columns should be ordered naturally or by size.
In Table 1 , the rows and columns are arranged according to the row or column sums. Alternatively, an alphabetical sorting according to the name of the hair or eye color would have been possible. The order in Table 2 is based on Table 1, as the reader is already familiar with the order in Table 1. - Do not use repetitive characters such as B. use "ditto".
Better to leave the space blank or simply repeat the number. - Tables should not contain disjointed information.
It is then better to divide the information into two or more tables. For example, Tables 1 and 2 could have been combined into one table, but the information is better presented in two tables. - The layout should "guide" the eye:
- Avoid vertical lines
- Avoid double lines
- To support legibility, it is better to use background colors instead of a line "network"
- A good example can be found in the documentation for the LaTeX package booktabs on page 2.
- Units of measurement should be written in the head of the respective column.
If the units of measurement are omitted, it is unclear in which unit the data are given. If you write it at the bottom of the table, you have to look for it first. - For columns and rows, totals (or averages) should be given if possible / necessary.
This saves a reader having to calculate the sums and also allows him to check the table values. - It is better to place values to be compared in different columns and not in different rows.
From each column in Table 2, a statistician can immediately deduce from the different values that there is a connection between hair and eye color. - Texts should be left-justified.
Readers whose native language is German are used to the fact that text is written from left to right and can therefore grasp left-justified text more quickly. In languages in which the direction of writing is different, e.g. B. Hebrew or Arabic , one will prefer right-aligned texts. - The following applies to numbers:
- Large numbers should be set upwards if possible
- They should be right justified
- They should be rounded to two to three significant digits
- They should contain leading zeros, ie "0.1" instead of ", 1"
- The decimal points for numbers in a column should always be below each other.
- Table 2 gives an example of this. However, rounding the entries to whole percentages with commercial rounding leads to the problem that the line total is no longer 100%, but 99% or 101%. Therefore, the sum-preserving rounding was used here.

The rules are intended to help improve understanding and readability of tables and are not absolute. Table 1 shows the eye and hair color data set with the absolute frequencies of statistical students with the aim of showing a relationship between eye and hair color. The rules have been followed as far as possible, e.g. B. the background color changes from line to line to make it easier to read the values in a line, or the eye and hair colors have been sorted according to the size of the column or line sums. Since the table standard in Wikipedia provides for a line network, this has been retained, in contrast to the rules. From table 2 it can be seen that there is a relationship between hair color and eye color.
Visualization
With a heat map

There are various options for displaying tables with numerical values in graphical form. One possibility is to replace the numerical entries with symbols or colors.
In the figure, the frequencies in Table 1 have been replaced by rectangles with corresponding gray levels. The darker a rectangle appears, the more often the corresponding combination of characteristics occurred in the 592 statistics students. The combination of brown eyes and hair was the most common, the combination of green eyes and black hair or brown eyes and blonde hair the least common.
With a mosaic plot

Since Tables 1 and 2 show absolute and conditional frequencies, they can also be shown in a so-called mosaic plot. The height of each rectangle is determined by the relative proportion of the corresponding hair color. For the hair color brown it results , i. This means that the rectangles in the 1st line have a height of approx. 48% of the total height of the graphic. The width of the rectangles results from the conditional frequencies in Table 2. The rectangle for brown hair and brown eyes therefore has a width of 42% of the total width of the graphic. The proportion of the area for a combination of features in the total area corresponds exactly to the proportion of this combination of features. So the area for the brown rectangle corresponds to , i. H. approx. one fifth of the total area.


See also
- List - one-dimensional table
- Matrix - arrangement of numerical values or other objects in tabular form in linear algebra
- Table digits - special digits with the same width ( thickness ) so that the digits are flush with each other.
Web links
Individual evidence
- ↑ Table - Duden , Bibliographisches Institut , 2020
- ↑ a b DIN 5008 : 2020-03, Sections 14.1 Tables of Numbers - General and 14.4 Tables of Numbers - Table header and front column
- ^ RD Snee: Graphical display of two-way contingency tables . In: The American Statistician . tape 28 , 1974, p. 9-12 .
- ^ Rüdiger Ostermann, Adalbert FX Wilhelm, Karin Wolf-Ostermann: Presentation of statistical data in nursing, Part 1 - Tables: More complicated than you think . In: Care magazine . tape 1 , 2004, p. 18-21 .
- ↑ Michael Piefel: Golden Rules. Retrieved December 15, 2012 .
- ^ Edward R. Tufte: The Visual Display of Quantitative Information . Graphics Press, 1983.
- ^ Edward R. Tufte: Envisioning Information . Graphics Press, 1990.
- ↑ a b Simon Fear: Publication quality tables in LaTeX. (PDF; 194 kB) In: Comprehensive TeX Archive Network. April 14, 2005, accessed January 4, 2013 .
- ↑ George A. Miller: The magical number seven, plus or minus two: Some limits on our capacity for processing information . In: Psychological Review . tape 63 , no. 2 , 1956, p. 81-97 , doi : 10.1037 / h0043158 .