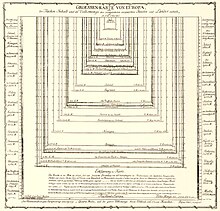
Area chart
An area diagram graphically shows the development of quantities. The form of representation is based on the line diagram . The areas between the axis and the lines are highlighted with different colors, patterns or hatching. Often two or more quantities are compared. In this case one speaks of a stacked or subdivided area chart.
One speaks of an overlaid area diagram if the value curves intersect at least once. The colors of the surfaces must be displayed differently for each case.
This representation is particularly suitable for comparing several time series.
This type of statistical representation was first developed in 1818 by August Friedrich Wilhelm Crome .
Web links
Commons : Area Charts - collection of images, videos, and audio files
Individual evidence
- ↑ Thomas Etzemüller: In search of the Nordic man: The German racial anthropology in the modern world , Transcript Verlag , 2015, ISBN 9783839431832 , p. 41 [1]


