Sensitivity analysis
| This item has been on the quality assurance side of the portal mathematics entered. This is done in order to bring the quality of the mathematics articles to an acceptable level .
Please help fix the shortcomings in this article and please join the discussion ! ( Enter article ) |
The sensitivity analysis (also: Sensitivity analysis , sensitivity analysis ) is a going back to the economics methodology, can be evaluated with the how sensitive indicators react to small changes in input parameters.
Definition
The term sensitivity was Germanized from the English (English. Sensitivity) and has largely supplanted the original term sensitivity in the field of economics. The term can also be equated with sensitivity. In measurement technology, for example, sensitivity is the change in the values displayed by the measuring device in relation to the changes in the measured variable. The sensitivity expresses how sensitively the display of a measuring device reacts. The sensitivity analysis generally provides information on how much changes in the input conditions influence a result, i.e. how sensitive, sensitive or sensitive a system reacts.
Areas of application
The sensitivity analysis is often used in the area of investment calculation ( profitability calculation , profitability analysis ). The investment calculation provides key figures for the profitability of investments. For this, several assumptions about the future usually have to be made. For example, the probable investment costs can often only be determined with residual uncertainty. This also applies to income and expenses during the useful life. In rental projects, for example, the rental income depends on the rental market and the occupancy rate achieved, and the maintenance costs on the damage that actually occurs and the price development for repairs. In wind power projects, the current income depends on the duration and strength of the wind, the feed-in tariff and the availability of the system, while there is also a more or less known development in the operating costs. These uncertainties have a decisive influence on the results of investment calculations, i.e. whether an investment will prove to be economical or not. The sensitivity analysis can show how much the profitability is changed by the influencing factors - i.e. how sensitively it reacts to influences.
Procedure of the method
When calculating the investment, the non-recurring and ongoing income and expenses must first be determined. If these amounts are listed in annual slices as a subtotal (income minus expenditure) in ascending order by years, you get an investment series. If the capital value method is applied to the investment series, the investment calculation provides the capital value and the amortization period . In addition, the internal return on capital can be determined as a further key figure on this basis . For each investment series, only one parameter is determined for the net present value, amortization time and internal rate of return (internal rate of return).
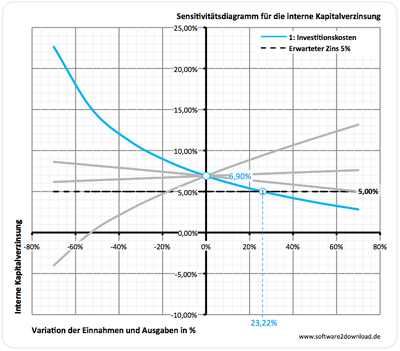
The sensitivity analysis now looks at the extent to which these key figures are influenced by changes in the investment series, i.e. by changes in one-off and current income and expenses. For this purpose, individual parameters are changed and the results of the investment calculation are recalculated. If the changes are made for individual parameters as a percentage over an entire range of variation, the results can be displayed in a sensitivity diagram (see Figure 1).
In Figure 1, the internal rate of return was plotted as a sensitivity diagram. In the investment series, parameter 1: investment costs were varied within a range of +/- 80%. With a change of 0%, the investment calculation in the example would still result in an internal return on capital of 6.90%. If the investment costs rise by a percentage, this results in a falling internal return on capital. The sensitivity diagram clearly shows how much the internal return on capital can be influenced by changes in investment costs, i.e. how sensitively it reacts. When calculating the investment, it is of particular importance to what extent the input parameters may change so that economic efficiency is just given. In Figure 1, this is still there when the investment costs increase by a maximum of 23.22%. At this value, the graph intersects the expected interest rate (in the example default interest rate 5.00%).
In this way, all other parameters for income and expenditure can be displayed as graphs in sensitivity diagrams. As in the example, all parameters are varied over a certain percentage value range and the result is displayed as a graph in the diagram.
In addition to the internal return on capital, the capital value can also be output in the sensitivity diagram. Profitability is achieved when the net present value is zero (see Figure 2).
Technical applications
Basically, the representation as a sensitivity diagram can also be used in technical areas. Here, for example, measurement and control technology should be considered, in which, as a rule, non-electrical input variables are converted into electrical variables and thus made accessible to an electronic display or computational evaluation.
In all of these processes, it is characteristic of the extent to which physical input variables such as temperature, pressure, relative humidity or level act on the measuring system and lead to electrical output signals ( transfer function ). Here, too, how sensitively the output signals react to changes in the physical input variables plays a central role.
See also
- Elasticity (economy)
- Systems theory
- Systems theory (engineering sciences)
- Biological cybernetics
- Mathematical model
- Transfer function
literature
- Paul M. Frank: Sensitivity Analysis of Dynamic Systems: An Introductory Presentation. Oldenbourg, Munich 1976, ISBN 3-486-34811-6
- Assem Deif: Sensitivity Analysis in Linear Systems. Springer, Berlin 1986, ISBN 3-540-16312-3
- Stefan Schwarz: Sensitivity analysis and optimization for nonlinear structural response . [Report / Institute for Structural Analysis, Univ. Stuttgart 34] Diss. Univ. Stuttgart 2001, ISBN 3-00-007419-8
- Andrea Saltelli (ed.): Global sensitivity analysis: the primer. Wiley, Chichester 2008, ISBN 978-0-470-74382-9


