
User talk:WikiCheckee and Talk:Solar energy: Difference between pages
Britney picture |
m →Lead section: agreed |
||
| Line 1: | Line 1: | ||
{{notaforum}} |
|||
'''Welcome!''' |
|||
{{talkheader}} |
|||
{{ArticleHistory |
|||
|action1=GAN |
|||
|action1date=11 September 2006 |
|||
|action1link=Talk:Solar energy/Archive2#Good Article Suggestions |
|||
|action1result=failed |
|||
|action1oldid=75141152 |
|||
|action2=GAN |
|||
Hello, {{BASEPAGENAME}}, and [[Wikipedia:Introduction|welcome]] to Wikipedia! Thank you for [[Special:Contributions/{{BASEPAGENAME}}|your contributions]]{{#if:|, especially what you did for [[:{{{art}}}]]}}. I hope you like the place and decide to stay. Here are some pages that you might find helpful: |
|||
|action2date=2 August 2007 |
|||
*[[Wikipedia:Five pillars|The five pillars of Wikipedia]] |
|||
|action2link=Talk:Solar energy/Archive3#GA Failed |
|||
*[[Wikipedia:Tutorial|Tutorial]] |
|||
|action2result=failed |
|||
*[[Wikipedia:How to edit a page|How to edit a page]] |
|||
|action2oldid=148932877 |
|||
*[[Wikipedia:Article development|How to write a great article]] |
|||
*[[Wikipedia:Manual of Style|Manual of Style]] |
|||
I hope you enjoy editing here and being a [[Wikipedia:Wikipedians|Wikipedian]]! Please [[Wikipedia:Signatures|sign]] your messages on [[Wikipedia:talk page|discussion page]]s using four [[tilde]]s (<nowiki>~~~~</nowiki>); this will automatically insert your username and the date. If you need help, check out [[Wikipedia:Questions]], ask me on {{#if:|[[user talk:{{{1}}}|my talk page]]|my talk page}}, or ask your question on this page and then place <code><nowiki>{{helpme}}</nowiki></code> before the question. Again, welcome! <!-- Template:Welcome --> |
|||
[[User:DocteurCosmos|DocteurCosmos]] ([[User talk:DocteurCosmos|talk]]) 13:26, 11 September 2008 (UTC) |
|||
|action3=GAN |
|||
== Britney Spears image == |
|||
|action3date=29 July 2007 |
|||
While you were editing, didn't you see that big comment that said "<nowiki><!-- DO NOT CHANGE THIS IMAGE UNLESS YOU HAVE A FREELY LICENSED IMAGE TO REPLACE IT WITH. --> </nowiki>"? A screen capture from a video is '''not''' a freely licensed image. It's a copyrighted image, usable only under a claim of [[fair use]]. Such images are '''never''' allowed to illustrate a living person. Our rules are located in [[WP:NFCC]], [[WP:IUP]], and [[WP:FU]].—[[User:Kww|Kww]]([[User talk:Kww|talk]]) 15:53, 10 October 2008 (UTC) |
|||
|action3link=Talk:Solar energy/Archive3#"Quick fail" GA nomination |
|||
|action3result=failed |
|||
|action3oldid=161067929 |
|||
|action4=GAN |
|||
|action4date=5 November 2007 |
|||
|action4link=Talk:Solar energy#GA review from Goodfriend100 |
|||
|action4result=listed |
|||
|action4oldid=169444108 |
|||
|action5=PR |
|||
|action5date=21:47, 22 May 2008 |
|||
|action5link=Wikipedia:Peer review/Solar energy/archive1 |
|||
|action5result=reviewed |
|||
|action5oldid=214279967 |
|||
|action6=FAC |
|||
|action6date=19:13, 4 July 2008 |
|||
|action6link=Wikipedia:Featured article candidates/Solar energy/archive1 |
|||
|action6result=not promoted |
|||
|action6oldid=223563920 |
|||
|topic=Engtech |
|||
|currentstatus=GA |
|||
}} |
|||
{{WikiProjectBannerShell|1= |
|||
{{physics|class=GA|importance=mid|nested=yes}} |
|||
{{WikiProject Energy|class=GA|importance=top|nested=yes}} |
|||
{{environment|class=GA|nested=yes}} |
|||
}} |
|||
{{todo}} |
|||
{{User:MiszaBot/config |
|||
|maxarchivesize = 120K |
|||
|counter = 6 |
|||
|algo = old(336h) |
|||
|archive = Talk:Solar energy/Archive%(counter)d |
|||
}} |
|||
<!--Automatically goes to a new archive page if the archive is over 120 kB, threads with no new comments in the last 14 days get moved to the current archive page. Archiving is done once a day around midnight UTC--> |
|||
{{archive box| |
|||
* [[/Archive1]] - 2004-2005 |
|||
* [[/Archive2]] - 2006 - June 2007 |
|||
* [[/Archive3]] - June - October 2007 |
|||
* [[/Archive4]] - October - November 2007 |
|||
* [[/Archive5]] - November 2007 - June 2008 |
|||
* [[/Archive6]] - June 2008 - present |
|||
* [[/Archive7]] |
|||
* [[/Archive8]] |
|||
}} |
|||
{{WP1.0|class=GA|importance=high|category=category|VA=yes|small=yes}} |
|||
== Why shouldn't this article include examples of environmentalist opposition to solar power? == |
|||
I added 3 examples of environmental opposition to solar power to this article, but an unregisitgered user moved them to the [[Solar power in the United States]] article. I think they should be included here, because this article should be balanced. [[User:Grundle2600|Grundle2600]] ([[User talk:Grundle2600|talk]]) 20:05, 22 August 2008 (UTC) |
|||
:The article seems to be against the route transmission lines would take in a special situation rather than solar energy in general. The vast majority of installed PV either completely eliminates the need to run transmission lines (off-grid) or is built adjacent to the existing grid (Nellis, Rancho Seco, grid-connected homes). The location for the huge project PG&E recently announced was chosen specifically because it fell alongside the existing transmission lines running out of Diablo Canyon. The PV guru Martin Green has argued that PV reduces the need to expand transmission capacity because it is generally sited closer to end users thus reducing the load on the lines. So, I don't think the article is representative of the way PV is generally sited. It's also rather vague when it comes to details that specifically relate to solar energy. Do you have any other sources that mention this issue? [[User:Mrshaba|Mrshaba]] ([[User talk:Mrshaba|talk]]) 22:22, 22 August 2008 (UTC) |
|||
::See [http://www.mydesert.com/apps/pbcs.dll/article?AID=/20080707/NEWS07/807070302/1026/news12 here] |
|||
"But David Hogan, a San Diego-based conservation manager at the Center for Biological Diversity, questions SDG&E's math. |
|||
"The Utility Conservation Action Network has shown SDG&E has wildly underrepresented the cost. It's going to be much more than $1.5 billion and much less for (installation) of rooftop solar," Hogan said. |
|||
::Judging from this quote it seems CBD is arguing for rooftop solar installations vs. a remote facility. So again, the opposition is not focused around solar energy but a transmission line. [[User:Mrshaba|Mrshaba]] ([[User talk:Mrshaba|talk]]) 22:47, 22 August 2008 (UTC) |
|||
:::It's also uniquely applicable to the United States, and just deals with the permitting process there, and of no interest to anyone from say, England, Germany, France, Spain, Australia, should I go on? That is why it was moved to the appropriate article - SP in the US. Anyone who argues that rooftop solar is cheaper than CSP doesn't know what they are talking about, by the way, which they would quickly learn if they read a few WP articles on the subject. [[Special:Contributions/199.125.109.134|199.125.109.134]] ([[User talk:199.125.109.134|talk]]) 02:33, 23 August 2008 (UTC) |
|||
::::For comparison, [[Environmental effects of wind power]] is a collection of (seemingly) every sort of environmental or aesthetic objection to [[wind power]]. Having a separate "Environmental effects of ..." article allows the primary article to [[WP:SUMMARY|summarize]] these effects, and avoid becoming a battleground. Anyone who wants to really understand any form of commercial-scale power generation (whether centralized or distributed) needs to be familiar with all the objections to it that various people have dreamed up in various places. The solar power folks in, say, Germany certainly need to pay attention to disputes over solar power in the U.S., if only to be sure their local conditions are sufficiently different to preclude the same kinds of disputes. Market conditions in one country may affect companies in another country, due to international trade (for example, the U.S. imports thousands of [[wind turbine]]s from European countries such as [[Vestas]], so those companies have to care about energy policy in the U.S. which could affect wind turbine sales). Every form of commercial-scale power has some sort of environmental or social impact. Even though the side effects of solar power may be negligible in comparison to the potentially disastrous effects of large-scale fossil fuel [[peak oil|drawdown]], the side effects are not zero, and belong in any comprehensive treatment of the subject. Although of course we don't have to cram everything into the main article on a subject, when we can have any number of subsidiary articles to treat the side topics. --[[User:Teratornis|Teratornis]] ([[User talk:Teratornis|talk]]) 07:24, 21 September 2008 (UTC) |
|||
== Solar Waste water treatment == |
|||
Added a new section to the Article, glaring ommission previously but it does not readily fit into existing structure, so have added it at end of Article. Feel free to relocate it. |
|||
This is one reason a new structure is needed, I will post and revert for discussion a proposed new structure edit soon that will present better and provide for this section. [[User:Jagra|Jagra]] ([[User talk:Jagra|talk]]) 07:26, 29 August 2008 (UTC) |
|||
:I think it belongs in the existing section Desalination and disinfection, but will wait for other views. It could also be shorter and I'm not sure that it is relevant to discuss whether it is better to desalinate or to treat waste water. So much depends on the location and the purpose of treating the water, and the question may be independent of whether solar methods are used. Also, if we go into too much length we start to raise more questions, e.g. why would such a method be used in preference to a reed bed or related method of filtration - and since reeds need sunlight to grow, is a reed bed a solar technology anyway? Best short and sweet and within the existing section. Will be interested to read your proposals for a new structure, but I'm not convinced that we will ever be able to find a universally agreed taxonomy for this diverse group of technologies. Nice to see peace breaking out on the article while I was away and that there are new editors around. [[User:Itsmejudith|Itsmejudith]] ([[User talk:Itsmejudith|talk]]) 21:09, 3 September 2008 (UTC) |
|||
== What to do now for FA? == |
|||
Hi everyone. Progress on the article seems to have stopped. I am not sure why a restructuring is necessary or whether any of the things on the to-do list are still outstanding. I would like to see the article resubmitted for judgement as soon as possible. Also, although I dread to raise this, is there now consensus on the illustrations. I thought there was consensus that the box diagram was misleading and should go????[[User:Itsmejudith|Itsmejudith]] ([[User talk:Itsmejudith|talk]]) 12:57, 17 September 2008 (UTC) |
|||
:It has been suggested that this article be cut and pasted into [[History of solar power]] and the article be restructured, taking out all the duplication from all the sub-articles. If you look at the SEIA (Solar Energy Industries Association) website, there are only four ways to use solar energy: "There are four ways we harness solar energy: photovoltaics (converting light to electricity), heating and cooling systems (solar thermal), concentrating solar power (utility scale), and lighting." Normally unless something has radically changed there is no point in resubmitting an article right away. [[User:Apteva|Apteva]] ([[User talk:Apteva|talk]]) 01:18, 19 September 2008 (UTC) |
|||
::I'm perfectly happy to have a History of solar power article, but I don't think that very much of this article should go into it. And I'm not particularly impressed by the SEIA idea that there are exactly four ways we harness solar energy. That is one way of grouping the technologies, but it is only one way. It also leaves out solar water purifiying, desalination and several other applications we mention here. [[User:Itsmejudith|Itsmejudith]] ([[User talk:Itsmejudith|talk]]) 18:34, 19 September 2008 (UTC) |
|||
:::The SEIA grouping also leaves out [[hydropower]], [[wind power]], and [[agriculture]] which are other ways we use solar energy. [[Fossil fuel]]s represent stored (ancient) solar energy according to mainstream geological theory. Most energy available to humans derives ultimately from solar energy, with some exceptions including [[nuclear power]], [[geothermal power]], and [[tidal power]]. However, by convention we usually consider the indirect applications of solar energy to be separate topics. Thus the SEIA should not say "there are <strike>only</strike> four ways" but rather, "We find it convenient to arbitrarily recognize four of the ways..." --[[User:Teratornis|Teratornis]] ([[User talk:Teratornis|talk]]) 18:28, 20 September 2008 (UTC) |
|||
::::Oops, I noticed the quote from the SEIA says "There are four ways...", and does not say "only." The word "only" appears to reflect [[User:Apteva|Apteva]]'s reading of the quote. The phrase "there are four" may be technically correct if there are ''at least'' four, but many people might read it as ''exactly'' four, as I did initially. --[[User:Teratornis|Teratornis]] ([[User talk:Teratornis|talk]]) 18:35, 20 September 2008 (UTC) |
|||
I was reviewing part of the SEIA website and noticed this page. [http://www.seia.org/cs/solar_technology_and_products] They combine solar lighting in with Passive Solar and leave out some sections (Chemical, Agriculture, Vehicles) but there's plenty of organizational overlap and I'd say this tends to validate the basic layout of the technologies on this page. [[User:Mrshaba|Mrshaba]] ([[User talk:Mrshaba|talk]]) 08:11, 8 October 2008 (UTC) |
|||
== 12-Year-Old May Hold Key to Solar Energy == |
|||
http://news.yahoo.com/s/zd/20080919/tc_zd/232218 [[User:Bioye|Bioye]] ([[User talk:Bioye|talk]]) 14:18, 20 September 2008 (UTC) |
|||
:That article seems to have been written by a reporter who knows little or nothing about physics or solar energy. It makes the [[Cosmos: A Personal Voyage#Episode 12: Encyclopedia Galactica|extraordinary claim]]: "...one 12-year-old boy may have the key to making solar panels that can harness 500 times the light of a traditional solar cell." The only way to get more light to a solar cell is to use some sort of mirror or lens to concentrate the light, but the article says nothing about that. Thus the "500 times" statement makes little sense, since "traditional solar cells" already harness about one fifth of the incident light energy. One fifth is one hundred times greater than one five hundredth as the article implies. The rest of the article rambles vaguely without explaining the bizarre claim it opens with. Unfortunately, popular press accounts of the field of energy have some examples of poor writing, which both result from and prey on the general public's lack of understanding of basic concepts from [[physics]] and [[engineering]]. For example, see [[Water-fuelled car]] and [[Perpetual motion machine]]. If you can find some [[WP:RS|reliable sources]] that describe this 12-year-old boy's invention coherently, you can work them into the appropriate [[WP:WIAA|article]](s) on Wikipedia. The link you gave does not appear to be a reliable source, at least with respect to its claim about the conversion efficiency of this solar cell. The source may be reliable about the name of the boy and the award he won, since the reporter needs no special training to relay those facts correctly. --[[User:Teratornis|Teratornis]] ([[User talk:Teratornis|talk]]) 18:13, 20 September 2008 (UTC) |
|||
::I should add that people do not necessarily judge the work of a 12-year-old as they would judge the work of an adult. When an adult invents something, we want to know whether it works. When a child invents something, we want to know what the invention says about the inventive ''potential'' of the child - whether the invention actually works or could reach commercial scale is secondary, because we're thinking about what the child will do in the future. When I was a child, I cooked up some fantastic ideas too, but none of them amounted to anything. It would be very hard for a child to produce a real breakthrough in the field of energy technology, because the field is very mature, and thus a child needs years of training just to catch up to current practice in some particular area. By the time the child knows enough to actually innovate, the child is usually an adult. --[[User:Teratornis|Teratornis]] ([[User talk:Teratornis|talk]]) 18:41, 20 September 2008 (UTC) |
|||
::: http://www.davidsongifted.org/fellows/Article/Davidson_Fellows___2008_405.aspx#table14 says |
|||
:::: "In his project, “High Efficient 3-Dimensional Nanotube Solar Cell for Visible and UV Light,” William invented a novel solar panel that enables light absorption from visible to ultraviolet light. He designed carbon nanotubes to overcome the barriers of electron movement, '''doubling''' the light-electricity conversion '''efficiency'''. William also developed a model for solar towers and a computer program to simulate and optimize the tower parameters. His optimized design provides '''500 times''' more light '''absorption''' than commercially-available solar cells and '''nine times''' more than the cutting-edge, three-dimensional solar cell." [''emph added''] |
|||
::: The "doubling" claim is extraordinary, but not impossible. I don't know what the "500 times" figure is supposed to mean. Maybe only 1/500th as much is ''not'' being absorbed? |
|||
:::[[User:Wwoods|—WWoods]] ([[User talk:Wwoods|talk]]) 00:03, 21 September 2008 (UTC) |
|||
::::The only way I see to make sense of the "500 times" is to assume "solar towers" refers to placing the solar cell at the focus of a [[Solar power tower]]. Thus the solar cell would have to be extremely durable. The first article still sounds a bit overblown because the total system cost for a solar power tower would still be high, even if putting solar cells at the focus would be cheaper than using a thermal collector. You still need the [[heliostat]]s and so on. Or maybe a hybrid system could use both, by cooling the solar cells with a working fluid that could then drive a heat engine. One advantage of the solar power tower is its ability to store heat energy in a reservoir of working fluid, allowing it to generate electricity for several hours after sunset. The thermal system also buffers brief interruptions in sunlight due to passing clouds, whereas photovoltaic cells would vary all over the place. Even if solar cells double in bang per buck, they still cost more than modern [[wind turbine]]s. Still, this item is interesting and might go into some subsidiary article, perhaps if we get a more coherent description of what exactly the young inventor came up with, and what effect it could have on the industry. (Although [[WP:CRYSTAL]] may apply.) --[[User:Teratornis|Teratornis]] ([[User talk:Teratornis|talk]]) 07:06, 21 September 2008 (UTC) |
|||
:::::I don't see any need to put it in the article at all. On the other hand the CSP article needs a better explanation of concentrating solar power using photovoltaics (here is the entire body of the article: "Technologies: Concentrating solar thermal (CST) and Concentrating PV (CPV) are the Concentrating solar power technologies.") - there is one company that I know of that is using a 1,000 to 1 concentration on the photovoltaic cell, using a parabolic mirror in two axes to concentrate the sunlight onto a 2.5 x 2.5 (approx) cm photocell. It also provides an equal amount of heat output - for every 1 kW electricity, they provide 1 kW heat as well, in the form of hot water. When you think about it, concentrating photovoltaics makes a lot more sense than flat panel photovoltaics, because for the price of a piece of 1/8th inch plywood and a roll of aluminum foil you can effectively multiply the efficiency of your silicon by a factor of 10 or even 100. You are not getting any more energy per square meter of land area, but you are concentrating the sun onto a smaller area and using less silicon for the same power output. The solar field is robust, but has a lot of evolving left to do, and somewhere between 1 and 1,000 an optimum number will eventually fall out (I think a fresnel lens gives a concentration of 2 or so). In reading the article, what the 500 number means is that the 12 year old is concentrating the sun by 500 and shining it on a complex surface with nanotubes etc just like a multilayer photovoltaic cell to extract a higher efficiency than available from a single cell solar panel. [[User:Apteva|Apteva]] ([[User talk:Apteva|talk]]) 01:11, 23 September 2008 (UTC) |
|||
== Graphic showing input scales == |
|||
So what is wrong with the graphic? It is sourced and appropriate to the topic. -- [[User:Skyemoor|Skyemoor]] ([[User talk:Skyemoor|talk]]) 10:51, 6 October 2008 (UTC) |
|||
:Would you like to look back at the previous discussions, Skyemoor. Also, compare this graphic with the source that is given. You will see that the graphic itself is not sourced at all. Some figures have been plucked out of the source graphic. The combination of them that has been made makes no sense. At all. It really doesn't. This is a very good example of why we don't publish original research. [[User:Itsmejudith|Itsmejudith]] ([[User talk:Itsmejudith|talk]]) 11:00, 6 October 2008 (UTC) |
|||
::A glance back in this section and the last archive doesn't show such a discussion. The solar, wind, hydro, and geothermal matches the indication verifiable source, though the consumption in the source is in BTUs, which would need to be converted to TWhr, a energy measurement instead of a power (energy flux) measurement as noted for the renewable energy sources. So while a graphic of sourced information is not of and by itself [[WP:OR]] as long as its scales can be determined, the subject graphic as it stands is incorrect. --[[User:Skyemoor|Skyemoor]] ([[User talk:Skyemoor|talk]]) 15:36, 6 October 2008 (UTC) |
|||
:::The discussions go further back and I'll look them out for you. The solar does not match the figure in the source graphic, at least it certainly does not if it is to be interpreted as "usable" solar. It includes all the solar energy incident upon the ocean, which if it were all used for human needs - depending how because it is such a completely hypothetical case - would mean that the hydrological cycle would be shut off. So much then for the quantity given for "hydro", if by hydro is meant generation from dams on rivers. Conversion of units is not in itself a problem. Taking figures from two sources produced for completely different purposes is. [[User:Itsmejudith|Itsmejudith]] ([[User talk:Itsmejudith|talk]]) 16:00, 6 October 2008 (UTC) |
|||
::::There's no problem taking information from more than one source, especially when one deals with inputs and the other deals with consumption. I can see your concern if the "solar" cube is not more carefully defined. However, such raw projections should not be disallowed, as any number of innovations could be implemented to harness solar power in the oceans. And the issue is not with conversion of units; it's with different ''types'' of units (energy vs. power). --[[User:Skyemoor|Skyemoor]] ([[User talk:Skyemoor|talk]]) 17:33, 6 October 2008 (UTC) |
|||
Many issues have been raised against the box diagram from multiple people. |
|||
*[[Talk:Solar energy/Archive5#RFC pictures]] |
|||
*[[Talk:Solar energy/Archive3#Image selection|Image selection]] |
|||
*[[Talk:Solar energy/Archive5#Picture changes|Picture change]] |
|||
*[[Image talk:Available Energy-2.jpg|Same picture different place]] |
|||
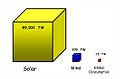
One issue with the picture is that the main source used for the diagram talks about EXERGY rather than ENERGY so the data is being interpreted off the top. A second issue is that the boxes are three dimensional but they are comparing one dimensional quantities. This skews the comparison of the quantities so that you're left comparing the numbers themselves and you could do this more clearly with a table or text. A third issue is that the diagram itself is a low quality picture - a consensus has established this. A fourth issue is that there isn't enough space in the area for another picture so the layout gets wonky with multiple pictures. [[User:Mrshaba|Mrshaba]] ([[User talk:Mrshaba|talk]]) 18:24, 6 October 2008 (UTC) |
|||
:Thanks for bringing these points to light; I now have a better understanding and agree that the image does not adequately compare potential sources of renewable energy. -- [[User:Skyemoor|Skyemoor]] ([[User talk:Skyemoor|talk]]) 18:52, 6 October 2008 (UTC) |
|||
::It is, however the best image we have to compare them. If you would like to create an alternate, have at it. Here are the ones available that I know of. |
|||
<gallery> |
|||
Image:Available Energy.jpg|<center>1</center> |
|||
Image:Available Energy-2.jpg|<center>2</center> |
|||
Image:Available Energy-3.png|<center>3</center> |
|||
Image:Available Energy-4.png|<center>4</center> |
|||
</gallery> |
|||
Take your pick. All of the data in 3 and 4 come from the same source. A separate reference is given for consumption, but the same number is used in the source used for all the other items. Exergy is useful energy. There isn't any other kind of energy that is interesting. See [[Wikipedia:Images_and_media_for_deletion/2008_October_3#Image:Available_Energy-3.png|this discussion]] (a misguided attempt to delete the image which did provoke some interesting responses about depicting data as an area or a volume). There are at least 3 other images in the article that are far less important than this one, if you wish to limit the number of images. This image has been in the article for a year and a half and there is no reason to delete it now. My only question is do users prefer 2, 3, or 4? [[User:Apteva|Apteva]] ([[User talk:Apteva|talk]]) 07:56, 7 October 2008 (UTC) |
|||
:It seems you added the image last September with [http://en.wikipedia.org/w/index.php?title=Solar_energy&diff=prev&oldid=159830672 this edit]. The Rfc followed in October and several people voiced displeasure with the diagram at that time. It has been removed dozens of times by multiple editors. [[User:Mrshaba|Mrshaba]] ([[User talk:Mrshaba|talk]]) 08:26, 7 October 2008 (UTC) |
|||
::Wrong. It is an important part of the article. Of course once in a while someone comes along with the intent to sabotage the article and takes it out but it always gets restored. I find it especially telling that someone with a background of working for the nuclear industry would "lose interest" in the project now that they are no longer working at a nuclear power plant, yet only come back to voice opposition to this important image. [[User:Apteva|Apteva]] ([[User talk:Apteva|talk]]) 16:15, 7 October 2008 (UTC) |
|||
:::I am an engineer with a background in solar engineering, and modeled/designed the passive solar aspects of my home and specified the grid-tied PV system with battery backup, so I'm not anti-solar in any stretch of the imagination. If you want to portray the information in the article, I suggest you find a government diagram that captures what you desire, then determine its efficacy here. The current set of diagrams above are incorrect per my comments above. --[[User:Skyemoor|Skyemoor]] ([[User talk:Skyemoor|talk]]) 17:35, 7 October 2008 (UTC) |
|||
::::There is nothing wrong with either 2, 3 or 4 above. Many of the government diagrams are not Public Domain, so it is necessary to create them from the underlying data, as was done above. By your "comments above" you are, I take it, referring to the comments of Mrshaba, and not "So what is wrong with the graphic? It is sourced and appropriate to the topic."? I can not say that I have any background in solar engineering, though it doesn't take a rocket scientist to see from the diagram above that there might be sufficient solar energy available to meet all of our needs, something that is much better expressed in a diagram than in numbers, as numbers mean nothing to the average person, even to the average policy maker. I'm not advocating anything, I'm trying to find out the facts. The three fundamental questions, to me, that this article should address, are 1) how much solar energy is available, which is addressed by this diagram, 2) how much land area would it require, which is addressed by a separate diagram, and 3) how much would it cost, which is currently missing from the article. I really don't care a lot about anything other than addressing those three questions. I recently saw someone throw out a number of 45 Trillion dollars to convert to renewable energy, if I can find it again I can add it, if it is relevant. I do have a personal goal of starting a Gobi Desert project to create a solar project that sold 80% of the electricity produced and used 20% of its output to create more solar panels and sell 20% of the panels for revenue, but kept 80% to slowly march across the desert, with the goal of eventually meeting all of Asia's energy demand. The cost of the project would actually be zero, because it would be self sustaining. [[User:Apteva|Apteva]] ([[User talk:Apteva|talk]]) 18:28, 7 October 2008 (UTC) |
|||
:::::Admirable goals, we wish you good luck. My comments included "the consumption in the source is in BTUs, which would need to be converted to TWhr, a energy measurement instead of a power (energy flux) measurement as noted for the renewable energy sources. So while a graphic of sourced information is not of and by itself WP:OR as long as its scales can be determined, the subject graphic as it stands is incorrect." I also agree with "It includes all the solar energy incident upon the ocean, which if it were all used for human needs - depending how because it is such a completely hypothetical case - would mean that the hydrological cycle would be shut off." So simply find a verifiable source that discusses the potential amount of power that could be collected by the sources you note (or plainly state that the energy is simply that which is striking the earth at any point in time). The freehand boxes do not have any scale, so they are not appropriate. --[[User:Skyemoor|Skyemoor]] ([[User talk:Skyemoor|talk]]) 19:22, 7 October 2008 (UTC) |
|||
::::::As I have said before, there is no problem with pointing out that the amount of solar energy reaching the earth (land surface) is sufficient to meet energy needs many times over. No-one editing this article has disputed that fact. We can find good sources that make the point. Let us be guided by how they make the point. Personally, I do not see the point of prioritising the issue of how much land space it would take. The major limiting factors in PV expansion are cost, transmission and storage. Advocates of renewables agree that PV is one part of a strategy alongside wind and wave power, other technologies, and of course energy use reduction strategies. Please do look out the estimated cost of converting to renewable energy and that can be added to the relevant article. Of course it cannot be anything other than an attempt at an estimate. I'm going to take this issue to the OR noticeboard to get more eyes on it. [[User:Itsmejudith|Itsmejudith]] ([[User talk:Itsmejudith|talk]]) 21:35, 7 October 2008 (UTC) |
|||
No measure of energy consumption of the planet is meaningful without specifying a time span, and at that point you are no longer specifying energy, but power, the rate of consuming energy, which is measured in watts, not Btu, or kWh. My recollection is that 15/86,000 works out to less than 0.02%, and the oceans represent about 70% of the surface of the planet, so a rough comparison shows that it could be possible to use 0.02% of 86,000 without resorting to building any off-shore facilities. Just a hunch. You can check my math. The scale of the boxes doesn't matter as long as you use the same for each, and it is easy to measure them to see that they are reasonably accurate, and as for freehand? The lines look pretty straight to me, not what I would expect for freehand. And no, using 0.02%, or 0.2%, or even 2% does not mean that the hydrological cycle would be shut off. [[User:Apteva|Apteva]] ([[User talk:Apteva|talk]]) 00:28, 8 October 2008 (UTC) |
|||
:''Of course'' using solar energy that falls on the sea would not shut off the hydrological cycle! We do not have the technology and in any kind of foreseeable future will not have the technology to use more than a miniscule fraction of that energy. The point is that it is meaningless and misleading to suggest that 100% of it is "available" for human use. It isn't. [[User:Itsmejudith|Itsmejudith]] ([[User talk:Itsmejudith|talk]]) 10:42, 8 October 2008 (UTC) |
|||
::Then what number is? I don't have a problem with using that number as the amount of sunlight that strikes the Earth, though just as you said, taking it to the next step and saying that much power is available for conversion to electricity is OR. My other points have not been addressed, btw. --[[User:Skyemoor|Skyemoor]] ([[User talk:Skyemoor|talk]]) 13:10, 8 October 2008 (UTC) |
|||
:::Well, no-one said that the concept of "energy available for human use" ([[exergy]]) was easy to define, let alone measure. Hence the complex nature of the source diagram which Apteva has misread. [[User:Itsmejudith|Itsmejudith]] ([[User talk:Itsmejudith|talk]]) 13:49, 8 October 2008 (UTC) |
|||
::::When I made [http://en.wikipedia.org/w/index.php?title=Solar_energy&diff=next&oldid=155344625 this edit] my intention was to show the gross scale of solar energy flows in the environment. There are many studies that have made estimates of theoretically available vs. technically available solar energy and a simple enough table can be laid out. What are your other points Skyemoor? [[User:Mrshaba|Mrshaba]] ([[User talk:Mrshaba|talk]]) 16:01, 8 October 2008 (UTC) |
|||
:::::These data points are consistent (ZJ of energy), and are well sourced. I support the inclusion of this text. --[[User:Skyemoor|Skyemoor]] ([[User talk:Skyemoor|talk]]) 19:18, 8 October 2008 (UTC) |
|||
::::::Say hey... I hadn't noticed we lost that text. At about the time I decided to move the information from a bulleted format into a table Apteva, god bless him, converted the bullets into sentences but at some point some of the sentences must have dissolved. If I had my druthers I'd lay the info out in a table so you could make a linear comparison. What do you think Skyemoor? [[User:Mrshaba|Mrshaba]] ([[User talk:Mrshaba|talk]]) 22:23, 8 October 2008 (UTC) |
|||
:::::::Hello there. This isn't a private webpage. It isn't appropriate to say, "what do you think Joe?" Address yourself to everyone, please, "what do other people think?" Wikipedia is a collaborative effort, and if you or anyone is not interested in collaborating, I'm sure that there are many other websites that would be more appropriate. [[User:Apteva|Apteva]] ([[User talk:Apteva|talk]]) 05:28, 9 October 2008 (UTC) |
|||
(outdent) To bring this innocent bystander up to speed, could someone please tell me what exactly the numbers ''ought'' to be? That is, what exactly is it that the average reader is supposed to be able to read off of those graphs?<br />Also, if I understand it correctly, the problem with the image(s) boils down to the (in)appropriateness of a log10 scale (read: the scale/comparison ought to be linear). Am I identifying the issue correctly? -- [[User:Fullstop|Fullstop]] ([[User talk:Fullstop|talk]]) 16:08, 8 October 2008 (UTC) |
|||
:Read my first comment above and check out the links for some of the history. This issue does not concern using log10 graphs so much as getting a poor diagram off the page that several of us have been trying to do for over a year. [[User:Mrshaba|Mrshaba]] ([[User talk:Mrshaba|talk]]) 16:27, 8 October 2008 (UTC) |
|||
::Step by step please. A year is an awful lot to expect the incidental observer to catch up on. |
|||
::* there must be some ''reason'' behind trying for a year. If its not so much the use of log10 graphs, then it must be something else. Merely the fact that you have been trying for a year is completely irrelevant to identifying the problems or in finding a solution. |
|||
::* other than Apteva's own listing of the 4 diagrams above I can't even determine which images you folks are actually talking about. |
|||
::* from the previous discussion I have gathered that the objections are:<ul><li>the numbers being compared in the graph are not actually comparable</li><li>for practical reasons the numbers presented by the graph can never be achieved</li><li>the use of log10 scale & 3D volumes misrepresent the relative value of the numbers</li></ul>Are these the reasons why the diagrams are deemed invalid? What other reasons are there?<br /><small>(Incidentally, poor artwork is a non-issue. Bad art can be fixed).</small> |
|||
::* Can these issues be fixed?<br />If not,... <ul><li>Do the problems with the images (whatever they are) constitute a disservice to the reader?</li><li>Is there overwhelming agreement ''here'' that the images constitute a disservice to the reader?</li></ul> |
|||
::Your turn folks. Make the most of it. -- [[User:Fullstop|Fullstop]] ([[User talk:Fullstop|talk]]) 18:11, 8 October 2008 (UTC) |
|||
:::I beg to differ sir. Working on fixing a problem for a year most certainly is relevant. You might also consider that Apteva//199/Delphi234 are all the same guy so there's a sock issue and a COI going on because Delphi234 created one of the images and he's used several identities to reinsert/argue for the image's inclusion. WPs' dispute resolution procedures have so far failed to clear this issue. |
|||
:::Here's an effort at a step-by-step. The [[Talk:Solar energy/Archive5#RFC|first Rfc]] is a good primer. We came out of the Rfc with a consensus to remove the box diagram. We established that using a three dimensional figure to represent quantities misrepresents the info no matter what the info is. At that time there were also issues raised with the quality of information used to develop the boxes. The box diagram was removed based on the consensus but Apteva/199/Delphi234 continued to reinsert the diagram. |
|||
:::At some point the data in the diagram was readjusted so that it mostly came from a single source document. This transition introduced additional problems. #1: The data used conflicted with well sourced data that was already on the page. #2: The new data described EXERGY rather than ENERGY and then presented the information as power. i.e. This is the source of the OR issue. |
|||
:::Following this the box diagram moved into the lead and this really set me off because the diagram was already known to be objectionable and now it introduced the subject. After going back and forth we (Itsmejudith,Apteva and myself) took the intro picture issue to mediation. The mediation was 'supposed' to settle whether the box diagram was to remain but it didn't. |
|||
:::I hope that's a decent overview. As to your questions: The first image below (Available Energy 2) started things off a year ago and the second image (Available Energy 4) is the most recent version with the additional EXERGY issue. |
|||
<gallery> |
|||
Image:Available Energy-2.jpg |
|||
Image:Available Energy-4.png |
|||
</gallery> |
|||
:::*I have gathered that the objections are:<ul><li>the numbers being compared in the graph are not actually comparable</li> Yes, Theoretically available EXERGY is being compared to actual ENERGY use. A more reasonable comparison would show Theoretically available ENERGY and Technically available ENERGY and compare this to actual ENERGY use. A table or text would be the easiest way to do this and we figured this out a long time ago. |
|||
:::*<ul><li>the use of log10 scale & 3D volumes misrepresent the relative value of the numbers</li></ul>The log10 scale picture has never been used on the page to my knowledge so it hasn't been discussed. As to 3D volumes, the problem is describe in How To Lie With Statistics. When you use a 3D comparison the viewer doesn't adjust for the depth so it's a fundamentally poor way to display information and should be avoided no matter what the information is. Put it this way - If the numbers were not included below the boxes would you have a good clue what the ratio of sizes was between the boxes? |
|||
:::*<ul><li>Can these issues be fixed?</ul></li> The box diagram cannot be fixed because the problem is fundamental to the way boxes present information. A basic table showing Theoretically available vs. Technically available Energy seems to good way to lay out the info in my opinion. This would keep most of the information we already have while addressing the "promotion objections" that have been raised. |
|||
:::<ul><li>Do the problems with the images (whatever they are) constitute a disservice to the reader?</ul></li> I think so. |
|||
:::I hope that covers everything. [[User:Mrshaba|Mrshaba]] ([[User talk:Mrshaba|talk]]) 19:55, 8 October 2008 (UTC) |
|||
Actually it covers nothing. The real objection appears to be a simple desire by Mrshaba to not use the diagram. No objection that has any relevancy has ever been purported by anyone. The diagram on the other hand has wide acceptance and there are even some who rave about it. I am only to conclude that it is that acceptance that is the cause of Mrshaba's desire not to see it used. |
|||
I am going to back up and start again. Above are four images in a row, now labeled 1, 2, 3, and 4. The first is not practical because it misleads the reader. 2 was used for about a year, and was even deleted once because someone, not to mention any names, was unable or uninterested in looking up the source for the data, something that was taken care of, and the image was restored. 3 was created in order to address the concerns raised about the fact that the values used to create 2 came from a variety of sources, and geothermal was added. As you can see from the diagram, geothermal can supply a large portion of our energy needs, wind can supply all of our energy needs, and solar can supply virtually an infinite supply of energy by comparison. Only someone who really doesn't want anyone to know this would be opposed to having the diagram included in the article. |
|||
Once again, my only question, is which diagram do people prefer for the solar energy article, 2, 3, or 4? Or would anyone like to create an alternate image that can be used? My own preference is 3, because although 4 is much easier to read, it is a little busy and hydro does not need to be included in the solar article. I have no objection to either 2, 3, or 4 being used. I will not, however ever agree to ''not'' including some sort of diagram. Oh yes, I will add that 90% of the energy we use today is wasted, so any minor changes to any of the numbers are totally moot. [[User:Apteva|Apteva]] ([[User talk:Apteva|talk]]) 22:03, 8 October 2008 (UTC) |
|||
I just had an idea come to me for a graphic that someone could create, anyone who is good with drawing images. Draw a pallet full of 860 gold bars, on a hoist like they use to unload cargo from a ship, and label it 2,712 ZJ/year, Solar, then a tiny pallet with 9 gold bars on a pallet being unloaded, and label it 27 ZJ/year, Wind, and then a tiny sliver of gold, 1/7th of a bar, on a truck, signifying what we actually use, and label it 0.47 ZJ/year, Consumption. It's a pretty accurate depiction of energy availability, we are smothered in sun and wind and only need a small fraction of what is available to meet all of our needs. [[User:Apteva|Apteva]] ([[User talk:Apteva|talk]]) 06:05, 9 October 2008 (UTC) |
|||
:None of the graphics above is correct. 1) has no units, 2)3)4) all have a mismatch between power and energy, and are not drawn to scale. The labeling would need to include qualifiers that show that the solar energy shown is the amount of sunlight striking the earth, which is not the same as the amount of sunlight available for conversion to electricity or other human-usable form of energy. Similar situation with wind. I support the insertion of the information that MrShaba previously had posted. --[[User:Skyemoor|Skyemoor]] ([[User talk:Skyemoor|talk]]) 10:35, 9 October 2008 (UTC) |
|||
::I don't care about #1 because it has obvious other problems (though having no units is ''not'' one of them - the units, TW, are at the bottom of the abscissa, or x-axis for people like me who can't tell which is which), and you may have missed my point that we do not consume energy as if we drank a glass of milk one time only, we consume energy at a rate of use, which is not energy but power, the same as the incoming solar radiation, and I really strongly doubt that you have checked to see if they are drawn to scale (I have), but the ratios could be off by a lot and would be close enough anyway (although as mentioned, bad artwork can be fixed). The description and the caption can be whatever is needed to explain that it is the total energy striking the earth, and any other caveats needed - it isn't the diagram that is wrong. And finally, insertion of information that Mrshaba previously posted doesn't require discussion, just do it. I'm sure that someone will correct the manner in which it is inserted if there is any problem with it. However I can assure you that if it is put in as a table it will be replaced with a diagram, because most people have no clue what numbers mean, but everyone can understand a diagram. [[User:Apteva|Apteva]] ([[User talk:Apteva|talk]]) 14:46, 9 October 2008 (UTC) |
|||
==Lead section== |
|||
Please comment on the following two proposed lead sections: |
|||
1) http://en.wikipedia.org/w/index.php?title=Solar_energy&oldid=243749995 |
|||
2) http://en.wikipedia.org/w/index.php?title=Solar_energy&oldid=243775000 |
|||
Until an agreement has been reached the lead has been reverted to how it existed before the change was proposed. |
|||
;Comments: |
|||
The most obvious problems with #1 are that it is only 2 paragraphs instead of the required 3 or 4, it uses the inaccurate phrase "heat and light" (all energy comes to us from the sun in the form of radiant energy (light) - the sun would have to physically contact the earth for us to directly receive heat from the sun), it includes the inappropriate 99% (99.97%) instead of the word "most", and the second paragraph is a choppy list that includes only a subset of the important ways we use solar energy. The best part of #1 was incorporated into #2, retaining the best parts of the current lead section. [[User:Apteva|Apteva]] ([[User talk:Apteva|talk]]) 02:34, 9 October 2008 (UTC) |
|||
:[[WP:LP]] does not require 3 or 4 paragraphs. "Heat" is infra-red radiation, which is the energy of electromagnetic waves, but it is simpler for the average user simply to say "heat" in the lede, and delve deeper into the physics later in the article. Notice there was no mention of heat transfer by conduction, in contrast to your comment above. 99.97% is more specific and accurate than 'most', and is therefore much more desirable in WP in order to avoid [[WP:WW]]. The list is an overview, as this is a summary section. If you believe there are important items left off, please add them. I have no doubt that #1 can be improved, but #2 is even more awkward, starting with the first sentence; solar energy exists whether it is utilized or not, simply by heating rocks or ocean water. The second paragraph on building design does not flow well, and seems to have too much information for a summary section. --[[User:Skyemoor|Skyemoor]] ([[User talk:Skyemoor|talk]]) 20:20, 9 October 2008 (UTC) |
|||
::I disagree. [[WP:LEAD#Length]] states "The appropriate length of the lead section depends on the total length of the article. As a general guideline, the lead should be no longer than four paragraphs. The following suggestion may be useful: ... > 30,000 characters 3 or 4 paragraphs" Heat is not primarily infra-red radiation. Think of a pot of iron heated to 1,000 degrees. The infra-red radiation it gives off is a small percentage of the heat it contains. The reason for not using a percentage in the lead is the lead is an overall summary, and it isn't the percentage that is important, which is included in the body, it is the concept that is important, that "most" available energy is from solar energy. Remember that numbers mean nothing to most people. I would suggest working on #1 in a sandbox, it has far too many problems to be included. I really don't wish to add to a list of clauses, as sentences are better. The first sentence of the lead has never been something that anyone has been proud of, but "heat and light" is a complete zero. [[User:Apteva|Apteva]] ([[User talk:Apteva|talk]]) 21:43, 9 October 2008 (UTC) |
|||
:::You can disagree [[WP:LP]] does not ''require'' 3-4 paragraphs, but you only supplied evidence that says "The following suggestion may be useful". Your comparison of heat from the sun with a the heat contained within a boiling pot has nothing to do with the solar energy that reaches Earth and would be off by many 1000s of orders of magnitude. Working on improving the lede is entirely justifiable; let's do it in a sandbox as you describe and achieve consensus before making changes to the main article. --[[User:Skyemoor|Skyemoor]] ([[User talk:Skyemoor|talk]]) 10:38, 10 October 2008 (UTC) |
|||
::::The article has to be accessible to readers with a scientific/technical background and those without any such background at all. It will be extensively used for school projects but it should also provide good links for energy professionals. We all know that if we stand in the sunshine we can feel the warmth. The heat "comes from the sun". How do we explain this in the article? We have to say something, but I suggest we do it as quickly as possible and use the fact that we can link to other articles for more detail. We might also want to include some of the science in footnotes rather than in the article. [[User:Itsmejudith|Itsmejudith]] ([[User talk:Itsmejudith|talk]]) 10:56, 10 October 2008 (UTC) |
|||
I categorically reject the 3-4 paragraphs nonsense. The lede should be whatever length makes sense. And in general, shorter ledes are always better ''if'' they get the point across. We should never be making a lede longer "just because!" |
|||
The "heat and light" thing is more interesting. I disagree that heat is inherently inaccurate, because radiant heat is still called heat by a lot of people. I see your point that you want to distinguish it from conduction or convection, though. My proposal would be to replace "heat and light" with "light and radiant heat". It still rolls off the tongue easily; it is technically correct; and, since casual readers will tend to gloss over the word "radiant", I think it is still clear to the layman. I'm going to be [[WP:BOLD|bold]] and make the change, though I recognize with the recent history of this article I might get quickly reverted ;) Oh well... |
|||
The other points will require closer inspection. --[[User:Jaysweet|Jaysweet]] ([[User talk:Jaysweet|talk]]) 15:45, 10 October 2008 (UTC) |
|||
:I am a big fan of semicolons (as, coincidentally, my previous post demonstrates!) but the semicolons in paragraph 2 were not necessary, and arguably not appropriate. None of the individual clauses contained a comma, therefore there was no need to promote the separator from a comma to a semicolon in order to disambiguate clause delineations from subclause delineations. Commas will do just fine. |
|||
:I share some of Apteva's skepticism about the value of this list to the lede. I might prefer to be more general in the lede, perhaps with something like (just brainstorming here): |
|||
::''Solar energy can be used directly, for example in passive heating systems, or it can be converted to electricity via [[solar cells]] and other related technologies.'' |
|||
:That sort of gives the flavor without being a tedious list. Comments? --[[User:Jaysweet|Jaysweet]] ([[User talk:Jaysweet|talk]]) 15:51, 10 October 2008 (UTC) |
|||
::Thanks, Jaysweet, I agree with your input. -- [[User:Skyemoor|Skyemoor]] ([[User talk:Skyemoor|talk]]) 16:09, 10 October 2008 (UTC) |
|||
Revision as of 16:09, 10 October 2008
| This page is not a forum for general discussion about Solar energy. Any such comments may be removed or refactored. Please limit discussion to improvement of this article. You may wish to ask factual questions about Solar energy at the Reference desk. |
| This is the talk page for discussing improvements to the Solar energy article. This is not a forum for general discussion of the article's subject. |
Article policies
|
| Find sources: Google (books · news · scholar · free images · WP refs) · FENS · JSTOR · TWL |
| Archives: Index, 1, 2, 3, 4, 5, 6, 7, 8, 9 |
| Solar energy has been listed as one of the Engineering and technology good articles under the good article criteria. If you can improve it further, please do so. If it no longer meets these criteria, you can reassess it. | ||||||||||||||||||||||||||||
| ||||||||||||||||||||||||||||
| This article is of interest to the following WikiProjects: | ||||||||||||||||||||||||||||||||||||||||
| ||||||||||||||||||||||||||||||||||||||||
.jpg)

|
|
This page has archives. Sections may be automatically archived by Lowercase sigmabot III. |
Why shouldn't this article include examples of environmentalist opposition to solar power?
I added 3 examples of environmental opposition to solar power to this article, but an unregisitgered user moved them to the Solar power in the United States article. I think they should be included here, because this article should be balanced. Grundle2600 (talk) 20:05, 22 August 2008 (UTC)
- The article seems to be against the route transmission lines would take in a special situation rather than solar energy in general. The vast majority of installed PV either completely eliminates the need to run transmission lines (off-grid) or is built adjacent to the existing grid (Nellis, Rancho Seco, grid-connected homes). The location for the huge project PG&E recently announced was chosen specifically because it fell alongside the existing transmission lines running out of Diablo Canyon. The PV guru Martin Green has argued that PV reduces the need to expand transmission capacity because it is generally sited closer to end users thus reducing the load on the lines. So, I don't think the article is representative of the way PV is generally sited. It's also rather vague when it comes to details that specifically relate to solar energy. Do you have any other sources that mention this issue? Mrshaba (talk) 22:22, 22 August 2008 (UTC)
- See here
"But David Hogan, a San Diego-based conservation manager at the Center for Biological Diversity, questions SDG&E's math.
"The Utility Conservation Action Network has shown SDG&E has wildly underrepresented the cost. It's going to be much more than $1.5 billion and much less for (installation) of rooftop solar," Hogan said.
- Judging from this quote it seems CBD is arguing for rooftop solar installations vs. a remote facility. So again, the opposition is not focused around solar energy but a transmission line. Mrshaba (talk) 22:47, 22 August 2008 (UTC)
- It's also uniquely applicable to the United States, and just deals with the permitting process there, and of no interest to anyone from say, England, Germany, France, Spain, Australia, should I go on? That is why it was moved to the appropriate article - SP in the US. Anyone who argues that rooftop solar is cheaper than CSP doesn't know what they are talking about, by the way, which they would quickly learn if they read a few WP articles on the subject. 199.125.109.134 (talk) 02:33, 23 August 2008 (UTC)
- For comparison, Environmental effects of wind power is a collection of (seemingly) every sort of environmental or aesthetic objection to wind power. Having a separate "Environmental effects of ..." article allows the primary article to summarize these effects, and avoid becoming a battleground. Anyone who wants to really understand any form of commercial-scale power generation (whether centralized or distributed) needs to be familiar with all the objections to it that various people have dreamed up in various places. The solar power folks in, say, Germany certainly need to pay attention to disputes over solar power in the U.S., if only to be sure their local conditions are sufficiently different to preclude the same kinds of disputes. Market conditions in one country may affect companies in another country, due to international trade (for example, the U.S. imports thousands of wind turbines from European countries such as Vestas, so those companies have to care about energy policy in the U.S. which could affect wind turbine sales). Every form of commercial-scale power has some sort of environmental or social impact. Even though the side effects of solar power may be negligible in comparison to the potentially disastrous effects of large-scale fossil fuel drawdown, the side effects are not zero, and belong in any comprehensive treatment of the subject. Although of course we don't have to cram everything into the main article on a subject, when we can have any number of subsidiary articles to treat the side topics. --Teratornis (talk) 07:24, 21 September 2008 (UTC)
- It's also uniquely applicable to the United States, and just deals with the permitting process there, and of no interest to anyone from say, England, Germany, France, Spain, Australia, should I go on? That is why it was moved to the appropriate article - SP in the US. Anyone who argues that rooftop solar is cheaper than CSP doesn't know what they are talking about, by the way, which they would quickly learn if they read a few WP articles on the subject. 199.125.109.134 (talk) 02:33, 23 August 2008 (UTC)
- Judging from this quote it seems CBD is arguing for rooftop solar installations vs. a remote facility. So again, the opposition is not focused around solar energy but a transmission line. Mrshaba (talk) 22:47, 22 August 2008 (UTC)
Solar Waste water treatment
Added a new section to the Article, glaring ommission previously but it does not readily fit into existing structure, so have added it at end of Article. Feel free to relocate it.
This is one reason a new structure is needed, I will post and revert for discussion a proposed new structure edit soon that will present better and provide for this section. Jagra (talk) 07:26, 29 August 2008 (UTC)
- I think it belongs in the existing section Desalination and disinfection, but will wait for other views. It could also be shorter and I'm not sure that it is relevant to discuss whether it is better to desalinate or to treat waste water. So much depends on the location and the purpose of treating the water, and the question may be independent of whether solar methods are used. Also, if we go into too much length we start to raise more questions, e.g. why would such a method be used in preference to a reed bed or related method of filtration - and since reeds need sunlight to grow, is a reed bed a solar technology anyway? Best short and sweet and within the existing section. Will be interested to read your proposals for a new structure, but I'm not convinced that we will ever be able to find a universally agreed taxonomy for this diverse group of technologies. Nice to see peace breaking out on the article while I was away and that there are new editors around. Itsmejudith (talk) 21:09, 3 September 2008 (UTC)
What to do now for FA?
Hi everyone. Progress on the article seems to have stopped. I am not sure why a restructuring is necessary or whether any of the things on the to-do list are still outstanding. I would like to see the article resubmitted for judgement as soon as possible. Also, although I dread to raise this, is there now consensus on the illustrations. I thought there was consensus that the box diagram was misleading and should go????Itsmejudith (talk) 12:57, 17 September 2008 (UTC)
- It has been suggested that this article be cut and pasted into History of solar power and the article be restructured, taking out all the duplication from all the sub-articles. If you look at the SEIA (Solar Energy Industries Association) website, there are only four ways to use solar energy: "There are four ways we harness solar energy: photovoltaics (converting light to electricity), heating and cooling systems (solar thermal), concentrating solar power (utility scale), and lighting." Normally unless something has radically changed there is no point in resubmitting an article right away. Apteva (talk) 01:18, 19 September 2008 (UTC)
- I'm perfectly happy to have a History of solar power article, but I don't think that very much of this article should go into it. And I'm not particularly impressed by the SEIA idea that there are exactly four ways we harness solar energy. That is one way of grouping the technologies, but it is only one way. It also leaves out solar water purifiying, desalination and several other applications we mention here. Itsmejudith (talk) 18:34, 19 September 2008 (UTC)
- The SEIA grouping also leaves out hydropower, wind power, and agriculture which are other ways we use solar energy. Fossil fuels represent stored (ancient) solar energy according to mainstream geological theory. Most energy available to humans derives ultimately from solar energy, with some exceptions including nuclear power, geothermal power, and tidal power. However, by convention we usually consider the indirect applications of solar energy to be separate topics. Thus the SEIA should not say "there are
onlyfour ways" but rather, "We find it convenient to arbitrarily recognize four of the ways..." --Teratornis (talk) 18:28, 20 September 2008 (UTC)- Oops, I noticed the quote from the SEIA says "There are four ways...", and does not say "only." The word "only" appears to reflect Apteva's reading of the quote. The phrase "there are four" may be technically correct if there are at least four, but many people might read it as exactly four, as I did initially. --Teratornis (talk) 18:35, 20 September 2008 (UTC)
- The SEIA grouping also leaves out hydropower, wind power, and agriculture which are other ways we use solar energy. Fossil fuels represent stored (ancient) solar energy according to mainstream geological theory. Most energy available to humans derives ultimately from solar energy, with some exceptions including nuclear power, geothermal power, and tidal power. However, by convention we usually consider the indirect applications of solar energy to be separate topics. Thus the SEIA should not say "there are
- I'm perfectly happy to have a History of solar power article, but I don't think that very much of this article should go into it. And I'm not particularly impressed by the SEIA idea that there are exactly four ways we harness solar energy. That is one way of grouping the technologies, but it is only one way. It also leaves out solar water purifiying, desalination and several other applications we mention here. Itsmejudith (talk) 18:34, 19 September 2008 (UTC)
I was reviewing part of the SEIA website and noticed this page. [1] They combine solar lighting in with Passive Solar and leave out some sections (Chemical, Agriculture, Vehicles) but there's plenty of organizational overlap and I'd say this tends to validate the basic layout of the technologies on this page. Mrshaba (talk) 08:11, 8 October 2008 (UTC)
12-Year-Old May Hold Key to Solar Energy
http://news.yahoo.com/s/zd/20080919/tc_zd/232218 Bioye (talk) 14:18, 20 September 2008 (UTC)
- That article seems to have been written by a reporter who knows little or nothing about physics or solar energy. It makes the extraordinary claim: "...one 12-year-old boy may have the key to making solar panels that can harness 500 times the light of a traditional solar cell." The only way to get more light to a solar cell is to use some sort of mirror or lens to concentrate the light, but the article says nothing about that. Thus the "500 times" statement makes little sense, since "traditional solar cells" already harness about one fifth of the incident light energy. One fifth is one hundred times greater than one five hundredth as the article implies. The rest of the article rambles vaguely without explaining the bizarre claim it opens with. Unfortunately, popular press accounts of the field of energy have some examples of poor writing, which both result from and prey on the general public's lack of understanding of basic concepts from physics and engineering. For example, see Water-fuelled car and Perpetual motion machine. If you can find some reliable sources that describe this 12-year-old boy's invention coherently, you can work them into the appropriate article(s) on Wikipedia. The link you gave does not appear to be a reliable source, at least with respect to its claim about the conversion efficiency of this solar cell. The source may be reliable about the name of the boy and the award he won, since the reporter needs no special training to relay those facts correctly. --Teratornis (talk) 18:13, 20 September 2008 (UTC)
- I should add that people do not necessarily judge the work of a 12-year-old as they would judge the work of an adult. When an adult invents something, we want to know whether it works. When a child invents something, we want to know what the invention says about the inventive potential of the child - whether the invention actually works or could reach commercial scale is secondary, because we're thinking about what the child will do in the future. When I was a child, I cooked up some fantastic ideas too, but none of them amounted to anything. It would be very hard for a child to produce a real breakthrough in the field of energy technology, because the field is very mature, and thus a child needs years of training just to catch up to current practice in some particular area. By the time the child knows enough to actually innovate, the child is usually an adult. --Teratornis (talk) 18:41, 20 September 2008 (UTC)
- http://www.davidsongifted.org/fellows/Article/Davidson_Fellows___2008_405.aspx#table14 says
- "In his project, “High Efficient 3-Dimensional Nanotube Solar Cell for Visible and UV Light,” William invented a novel solar panel that enables light absorption from visible to ultraviolet light. He designed carbon nanotubes to overcome the barriers of electron movement, doubling the light-electricity conversion efficiency. William also developed a model for solar towers and a computer program to simulate and optimize the tower parameters. His optimized design provides 500 times more light absorption than commercially-available solar cells and nine times more than the cutting-edge, three-dimensional solar cell." [emph added]
- The "doubling" claim is extraordinary, but not impossible. I don't know what the "500 times" figure is supposed to mean. Maybe only 1/500th as much is not being absorbed?
- —WWoods (talk) 00:03, 21 September 2008 (UTC)
- The only way I see to make sense of the "500 times" is to assume "solar towers" refers to placing the solar cell at the focus of a Solar power tower. Thus the solar cell would have to be extremely durable. The first article still sounds a bit overblown because the total system cost for a solar power tower would still be high, even if putting solar cells at the focus would be cheaper than using a thermal collector. You still need the heliostats and so on. Or maybe a hybrid system could use both, by cooling the solar cells with a working fluid that could then drive a heat engine. One advantage of the solar power tower is its ability to store heat energy in a reservoir of working fluid, allowing it to generate electricity for several hours after sunset. The thermal system also buffers brief interruptions in sunlight due to passing clouds, whereas photovoltaic cells would vary all over the place. Even if solar cells double in bang per buck, they still cost more than modern wind turbines. Still, this item is interesting and might go into some subsidiary article, perhaps if we get a more coherent description of what exactly the young inventor came up with, and what effect it could have on the industry. (Although WP:CRYSTAL may apply.) --Teratornis (talk) 07:06, 21 September 2008 (UTC)
- I don't see any need to put it in the article at all. On the other hand the CSP article needs a better explanation of concentrating solar power using photovoltaics (here is the entire body of the article: "Technologies: Concentrating solar thermal (CST) and Concentrating PV (CPV) are the Concentrating solar power technologies.") - there is one company that I know of that is using a 1,000 to 1 concentration on the photovoltaic cell, using a parabolic mirror in two axes to concentrate the sunlight onto a 2.5 x 2.5 (approx) cm photocell. It also provides an equal amount of heat output - for every 1 kW electricity, they provide 1 kW heat as well, in the form of hot water. When you think about it, concentrating photovoltaics makes a lot more sense than flat panel photovoltaics, because for the price of a piece of 1/8th inch plywood and a roll of aluminum foil you can effectively multiply the efficiency of your silicon by a factor of 10 or even 100. You are not getting any more energy per square meter of land area, but you are concentrating the sun onto a smaller area and using less silicon for the same power output. The solar field is robust, but has a lot of evolving left to do, and somewhere between 1 and 1,000 an optimum number will eventually fall out (I think a fresnel lens gives a concentration of 2 or so). In reading the article, what the 500 number means is that the 12 year old is concentrating the sun by 500 and shining it on a complex surface with nanotubes etc just like a multilayer photovoltaic cell to extract a higher efficiency than available from a single cell solar panel. Apteva (talk) 01:11, 23 September 2008 (UTC)
- The only way I see to make sense of the "500 times" is to assume "solar towers" refers to placing the solar cell at the focus of a Solar power tower. Thus the solar cell would have to be extremely durable. The first article still sounds a bit overblown because the total system cost for a solar power tower would still be high, even if putting solar cells at the focus would be cheaper than using a thermal collector. You still need the heliostats and so on. Or maybe a hybrid system could use both, by cooling the solar cells with a working fluid that could then drive a heat engine. One advantage of the solar power tower is its ability to store heat energy in a reservoir of working fluid, allowing it to generate electricity for several hours after sunset. The thermal system also buffers brief interruptions in sunlight due to passing clouds, whereas photovoltaic cells would vary all over the place. Even if solar cells double in bang per buck, they still cost more than modern wind turbines. Still, this item is interesting and might go into some subsidiary article, perhaps if we get a more coherent description of what exactly the young inventor came up with, and what effect it could have on the industry. (Although WP:CRYSTAL may apply.) --Teratornis (talk) 07:06, 21 September 2008 (UTC)
- http://www.davidsongifted.org/fellows/Article/Davidson_Fellows___2008_405.aspx#table14 says
Graphic showing input scales
So what is wrong with the graphic? It is sourced and appropriate to the topic. -- Skyemoor (talk) 10:51, 6 October 2008 (UTC)
- Would you like to look back at the previous discussions, Skyemoor. Also, compare this graphic with the source that is given. You will see that the graphic itself is not sourced at all. Some figures have been plucked out of the source graphic. The combination of them that has been made makes no sense. At all. It really doesn't. This is a very good example of why we don't publish original research. Itsmejudith (talk) 11:00, 6 October 2008 (UTC)
- A glance back in this section and the last archive doesn't show such a discussion. The solar, wind, hydro, and geothermal matches the indication verifiable source, though the consumption in the source is in BTUs, which would need to be converted to TWhr, a energy measurement instead of a power (energy flux) measurement as noted for the renewable energy sources. So while a graphic of sourced information is not of and by itself WP:OR as long as its scales can be determined, the subject graphic as it stands is incorrect. --Skyemoor (talk) 15:36, 6 October 2008 (UTC)
- The discussions go further back and I'll look them out for you. The solar does not match the figure in the source graphic, at least it certainly does not if it is to be interpreted as "usable" solar. It includes all the solar energy incident upon the ocean, which if it were all used for human needs - depending how because it is such a completely hypothetical case - would mean that the hydrological cycle would be shut off. So much then for the quantity given for "hydro", if by hydro is meant generation from dams on rivers. Conversion of units is not in itself a problem. Taking figures from two sources produced for completely different purposes is. Itsmejudith (talk) 16:00, 6 October 2008 (UTC)
- There's no problem taking information from more than one source, especially when one deals with inputs and the other deals with consumption. I can see your concern if the "solar" cube is not more carefully defined. However, such raw projections should not be disallowed, as any number of innovations could be implemented to harness solar power in the oceans. And the issue is not with conversion of units; it's with different types of units (energy vs. power). --Skyemoor (talk) 17:33, 6 October 2008 (UTC)
- The discussions go further back and I'll look them out for you. The solar does not match the figure in the source graphic, at least it certainly does not if it is to be interpreted as "usable" solar. It includes all the solar energy incident upon the ocean, which if it were all used for human needs - depending how because it is such a completely hypothetical case - would mean that the hydrological cycle would be shut off. So much then for the quantity given for "hydro", if by hydro is meant generation from dams on rivers. Conversion of units is not in itself a problem. Taking figures from two sources produced for completely different purposes is. Itsmejudith (talk) 16:00, 6 October 2008 (UTC)
- A glance back in this section and the last archive doesn't show such a discussion. The solar, wind, hydro, and geothermal matches the indication verifiable source, though the consumption in the source is in BTUs, which would need to be converted to TWhr, a energy measurement instead of a power (energy flux) measurement as noted for the renewable energy sources. So while a graphic of sourced information is not of and by itself WP:OR as long as its scales can be determined, the subject graphic as it stands is incorrect. --Skyemoor (talk) 15:36, 6 October 2008 (UTC)
Many issues have been raised against the box diagram from multiple people.
One issue with the picture is that the main source used for the diagram talks about EXERGY rather than ENERGY so the data is being interpreted off the top. A second issue is that the boxes are three dimensional but they are comparing one dimensional quantities. This skews the comparison of the quantities so that you're left comparing the numbers themselves and you could do this more clearly with a table or text. A third issue is that the diagram itself is a low quality picture - a consensus has established this. A fourth issue is that there isn't enough space in the area for another picture so the layout gets wonky with multiple pictures. Mrshaba (talk) 18:24, 6 October 2008 (UTC)
- Thanks for bringing these points to light; I now have a better understanding and agree that the image does not adequately compare potential sources of renewable energy. -- Skyemoor (talk) 18:52, 6 October 2008 (UTC)
- It is, however the best image we have to compare them. If you would like to create an alternate, have at it. Here are the ones available that I know of.
-

1 -
2 -

3 -

4


Take your pick. All of the data in 3 and 4 come from the same source. A separate reference is given for consumption, but the same number is used in the source used for all the other items. Exergy is useful energy. There isn't any other kind of energy that is interesting. See this discussion (a misguided attempt to delete the image which did provoke some interesting responses about depicting data as an area or a volume). There are at least 3 other images in the article that are far less important than this one, if you wish to limit the number of images. This image has been in the article for a year and a half and there is no reason to delete it now. My only question is do users prefer 2, 3, or 4? Apteva (talk) 07:56, 7 October 2008 (UTC)
- It seems you added the image last September with this edit. The Rfc followed in October and several people voiced displeasure with the diagram at that time. It has been removed dozens of times by multiple editors. Mrshaba (talk) 08:26, 7 October 2008 (UTC)
- Wrong. It is an important part of the article. Of course once in a while someone comes along with the intent to sabotage the article and takes it out but it always gets restored. I find it especially telling that someone with a background of working for the nuclear industry would "lose interest" in the project now that they are no longer working at a nuclear power plant, yet only come back to voice opposition to this important image. Apteva (talk) 16:15, 7 October 2008 (UTC)
- I am an engineer with a background in solar engineering, and modeled/designed the passive solar aspects of my home and specified the grid-tied PV system with battery backup, so I'm not anti-solar in any stretch of the imagination. If you want to portray the information in the article, I suggest you find a government diagram that captures what you desire, then determine its efficacy here. The current set of diagrams above are incorrect per my comments above. --Skyemoor (talk) 17:35, 7 October 2008 (UTC)
- There is nothing wrong with either 2, 3 or 4 above. Many of the government diagrams are not Public Domain, so it is necessary to create them from the underlying data, as was done above. By your "comments above" you are, I take it, referring to the comments of Mrshaba, and not "So what is wrong with the graphic? It is sourced and appropriate to the topic."? I can not say that I have any background in solar engineering, though it doesn't take a rocket scientist to see from the diagram above that there might be sufficient solar energy available to meet all of our needs, something that is much better expressed in a diagram than in numbers, as numbers mean nothing to the average person, even to the average policy maker. I'm not advocating anything, I'm trying to find out the facts. The three fundamental questions, to me, that this article should address, are 1) how much solar energy is available, which is addressed by this diagram, 2) how much land area would it require, which is addressed by a separate diagram, and 3) how much would it cost, which is currently missing from the article. I really don't care a lot about anything other than addressing those three questions. I recently saw someone throw out a number of 45 Trillion dollars to convert to renewable energy, if I can find it again I can add it, if it is relevant. I do have a personal goal of starting a Gobi Desert project to create a solar project that sold 80% of the electricity produced and used 20% of its output to create more solar panels and sell 20% of the panels for revenue, but kept 80% to slowly march across the desert, with the goal of eventually meeting all of Asia's energy demand. The cost of the project would actually be zero, because it would be self sustaining. Apteva (talk) 18:28, 7 October 2008 (UTC)
- I am an engineer with a background in solar engineering, and modeled/designed the passive solar aspects of my home and specified the grid-tied PV system with battery backup, so I'm not anti-solar in any stretch of the imagination. If you want to portray the information in the article, I suggest you find a government diagram that captures what you desire, then determine its efficacy here. The current set of diagrams above are incorrect per my comments above. --Skyemoor (talk) 17:35, 7 October 2008 (UTC)
- Wrong. It is an important part of the article. Of course once in a while someone comes along with the intent to sabotage the article and takes it out but it always gets restored. I find it especially telling that someone with a background of working for the nuclear industry would "lose interest" in the project now that they are no longer working at a nuclear power plant, yet only come back to voice opposition to this important image. Apteva (talk) 16:15, 7 October 2008 (UTC)
- Admirable goals, we wish you good luck. My comments included "the consumption in the source is in BTUs, which would need to be converted to TWhr, a energy measurement instead of a power (energy flux) measurement as noted for the renewable energy sources. So while a graphic of sourced information is not of and by itself WP:OR as long as its scales can be determined, the subject graphic as it stands is incorrect." I also agree with "It includes all the solar energy incident upon the ocean, which if it were all used for human needs - depending how because it is such a completely hypothetical case - would mean that the hydrological cycle would be shut off." So simply find a verifiable source that discusses the potential amount of power that could be collected by the sources you note (or plainly state that the energy is simply that which is striking the earth at any point in time). The freehand boxes do not have any scale, so they are not appropriate. --Skyemoor (talk) 19:22, 7 October 2008 (UTC)
- As I have said before, there is no problem with pointing out that the amount of solar energy reaching the earth (land surface) is sufficient to meet energy needs many times over. No-one editing this article has disputed that fact. We can find good sources that make the point. Let us be guided by how they make the point. Personally, I do not see the point of prioritising the issue of how much land space it would take. The major limiting factors in PV expansion are cost, transmission and storage. Advocates of renewables agree that PV is one part of a strategy alongside wind and wave power, other technologies, and of course energy use reduction strategies. Please do look out the estimated cost of converting to renewable energy and that can be added to the relevant article. Of course it cannot be anything other than an attempt at an estimate. I'm going to take this issue to the OR noticeboard to get more eyes on it. Itsmejudith (talk) 21:35, 7 October 2008 (UTC)
- Admirable goals, we wish you good luck. My comments included "the consumption in the source is in BTUs, which would need to be converted to TWhr, a energy measurement instead of a power (energy flux) measurement as noted for the renewable energy sources. So while a graphic of sourced information is not of and by itself WP:OR as long as its scales can be determined, the subject graphic as it stands is incorrect." I also agree with "It includes all the solar energy incident upon the ocean, which if it were all used for human needs - depending how because it is such a completely hypothetical case - would mean that the hydrological cycle would be shut off." So simply find a verifiable source that discusses the potential amount of power that could be collected by the sources you note (or plainly state that the energy is simply that which is striking the earth at any point in time). The freehand boxes do not have any scale, so they are not appropriate. --Skyemoor (talk) 19:22, 7 October 2008 (UTC)
No measure of energy consumption of the planet is meaningful without specifying a time span, and at that point you are no longer specifying energy, but power, the rate of consuming energy, which is measured in watts, not Btu, or kWh. My recollection is that 15/86,000 works out to less than 0.02%, and the oceans represent about 70% of the surface of the planet, so a rough comparison shows that it could be possible to use 0.02% of 86,000 without resorting to building any off-shore facilities. Just a hunch. You can check my math. The scale of the boxes doesn't matter as long as you use the same for each, and it is easy to measure them to see that they are reasonably accurate, and as for freehand? The lines look pretty straight to me, not what I would expect for freehand. And no, using 0.02%, or 0.2%, or even 2% does not mean that the hydrological cycle would be shut off. Apteva (talk) 00:28, 8 October 2008 (UTC)
- Of course using solar energy that falls on the sea would not shut off the hydrological cycle! We do not have the technology and in any kind of foreseeable future will not have the technology to use more than a miniscule fraction of that energy. The point is that it is meaningless and misleading to suggest that 100% of it is "available" for human use. It isn't. Itsmejudith (talk) 10:42, 8 October 2008 (UTC)
- Then what number is? I don't have a problem with using that number as the amount of sunlight that strikes the Earth, though just as you said, taking it to the next step and saying that much power is available for conversion to electricity is OR. My other points have not been addressed, btw. --Skyemoor (talk) 13:10, 8 October 2008 (UTC)
- Well, no-one said that the concept of "energy available for human use" (exergy) was easy to define, let alone measure. Hence the complex nature of the source diagram which Apteva has misread. Itsmejudith (talk) 13:49, 8 October 2008 (UTC)
- When I made this edit my intention was to show the gross scale of solar energy flows in the environment. There are many studies that have made estimates of theoretically available vs. technically available solar energy and a simple enough table can be laid out. What are your other points Skyemoor? Mrshaba (talk) 16:01, 8 October 2008 (UTC)
- These data points are consistent (ZJ of energy), and are well sourced. I support the inclusion of this text. --Skyemoor (talk) 19:18, 8 October 2008 (UTC)
- Say hey... I hadn't noticed we lost that text. At about the time I decided to move the information from a bulleted format into a table Apteva, god bless him, converted the bullets into sentences but at some point some of the sentences must have dissolved. If I had my druthers I'd lay the info out in a table so you could make a linear comparison. What do you think Skyemoor? Mrshaba (talk) 22:23, 8 October 2008 (UTC)
- Hello there. This isn't a private webpage. It isn't appropriate to say, "what do you think Joe?" Address yourself to everyone, please, "what do other people think?" Wikipedia is a collaborative effort, and if you or anyone is not interested in collaborating, I'm sure that there are many other websites that would be more appropriate. Apteva (talk) 05:28, 9 October 2008 (UTC)
- Say hey... I hadn't noticed we lost that text. At about the time I decided to move the information from a bulleted format into a table Apteva, god bless him, converted the bullets into sentences but at some point some of the sentences must have dissolved. If I had my druthers I'd lay the info out in a table so you could make a linear comparison. What do you think Skyemoor? Mrshaba (talk) 22:23, 8 October 2008 (UTC)
- These data points are consistent (ZJ of energy), and are well sourced. I support the inclusion of this text. --Skyemoor (talk) 19:18, 8 October 2008 (UTC)
- When I made this edit my intention was to show the gross scale of solar energy flows in the environment. There are many studies that have made estimates of theoretically available vs. technically available solar energy and a simple enough table can be laid out. What are your other points Skyemoor? Mrshaba (talk) 16:01, 8 October 2008 (UTC)
- Well, no-one said that the concept of "energy available for human use" (exergy) was easy to define, let alone measure. Hence the complex nature of the source diagram which Apteva has misread. Itsmejudith (talk) 13:49, 8 October 2008 (UTC)
- Then what number is? I don't have a problem with using that number as the amount of sunlight that strikes the Earth, though just as you said, taking it to the next step and saying that much power is available for conversion to electricity is OR. My other points have not been addressed, btw. --Skyemoor (talk) 13:10, 8 October 2008 (UTC)
(outdent) To bring this innocent bystander up to speed, could someone please tell me what exactly the numbers ought to be? That is, what exactly is it that the average reader is supposed to be able to read off of those graphs?
Also, if I understand it correctly, the problem with the image(s) boils down to the (in)appropriateness of a log10 scale (read: the scale/comparison ought to be linear). Am I identifying the issue correctly? -- Fullstop (talk) 16:08, 8 October 2008 (UTC)
- Read my first comment above and check out the links for some of the history. This issue does not concern using log10 graphs so much as getting a poor diagram off the page that several of us have been trying to do for over a year. Mrshaba (talk) 16:27, 8 October 2008 (UTC)
- Step by step please. A year is an awful lot to expect the incidental observer to catch up on.
- there must be some reason behind trying for a year. If its not so much the use of log10 graphs, then it must be something else. Merely the fact that you have been trying for a year is completely irrelevant to identifying the problems or in finding a solution.
- other than Apteva's own listing of the 4 diagrams above I can't even determine which images you folks are actually talking about.
- from the previous discussion I have gathered that the objections are:
- the numbers being compared in the graph are not actually comparable
- for practical reasons the numbers presented by the graph can never be achieved
- the use of log10 scale & 3D volumes misrepresent the relative value of the numbers
(Incidentally, poor artwork is a non-issue. Bad art can be fixed). - Can these issues be fixed?
If not,...- Do the problems with the images (whatever they are) constitute a disservice to the reader?
- Is there overwhelming agreement here that the images constitute a disservice to the reader?
- Your turn folks. Make the most of it. -- Fullstop (talk) 18:11, 8 October 2008 (UTC)
- Step by step please. A year is an awful lot to expect the incidental observer to catch up on.
- I beg to differ sir. Working on fixing a problem for a year most certainly is relevant. You might also consider that Apteva//199/Delphi234 are all the same guy so there's a sock issue and a COI going on because Delphi234 created one of the images and he's used several identities to reinsert/argue for the image's inclusion. WPs' dispute resolution procedures have so far failed to clear this issue.
- Here's an effort at a step-by-step. The first Rfc is a good primer. We came out of the Rfc with a consensus to remove the box diagram. We established that using a three dimensional figure to represent quantities misrepresents the info no matter what the info is. At that time there were also issues raised with the quality of information used to develop the boxes. The box diagram was removed based on the consensus but Apteva/199/Delphi234 continued to reinsert the diagram.
- At some point the data in the diagram was readjusted so that it mostly came from a single source document. This transition introduced additional problems. #1: The data used conflicted with well sourced data that was already on the page. #2: The new data described EXERGY rather than ENERGY and then presented the information as power. i.e. This is the source of the OR issue.
- Following this the box diagram moved into the lead and this really set me off because the diagram was already known to be objectionable and now it introduced the subject. After going back and forth we (Itsmejudith,Apteva and myself) took the intro picture issue to mediation. The mediation was 'supposed' to settle whether the box diagram was to remain but it didn't.
- I hope that's a decent overview. As to your questions: The first image below (Available Energy 2) started things off a year ago and the second image (Available Energy 4) is the most recent version with the additional EXERGY issue.
- I have gathered that the objections are:
- the numbers being compared in the graph are not actually comparable Yes, Theoretically available EXERGY is being compared to actual ENERGY use. A more reasonable comparison would show Theoretically available ENERGY and Technically available ENERGY and compare this to actual ENERGY use. A table or text would be the easiest way to do this and we figured this out a long time ago.
- I have gathered that the objections are:
- the use of log10 scale & 3D volumes misrepresent the relative value of the numbers
- Can these issues be fixed?
The box diagram cannot be fixed because the problem is fundamental to the way boxes present information. A basic table showing Theoretically available vs. Technically available Energy seems to good way to lay out the info in my opinion. This would keep most of the information we already have while addressing the "promotion objections" that have been raised.
- Do the problems with the images (whatever they are) constitute a disservice to the reader?
Actually it covers nothing. The real objection appears to be a simple desire by Mrshaba to not use the diagram. No objection that has any relevancy has ever been purported by anyone. The diagram on the other hand has wide acceptance and there are even some who rave about it. I am only to conclude that it is that acceptance that is the cause of Mrshaba's desire not to see it used.
I am going to back up and start again. Above are four images in a row, now labeled 1, 2, 3, and 4. The first is not practical because it misleads the reader. 2 was used for about a year, and was even deleted once because someone, not to mention any names, was unable or uninterested in looking up the source for the data, something that was taken care of, and the image was restored. 3 was created in order to address the concerns raised about the fact that the values used to create 2 came from a variety of sources, and geothermal was added. As you can see from the diagram, geothermal can supply a large portion of our energy needs, wind can supply all of our energy needs, and solar can supply virtually an infinite supply of energy by comparison. Only someone who really doesn't want anyone to know this would be opposed to having the diagram included in the article.
Once again, my only question, is which diagram do people prefer for the solar energy article, 2, 3, or 4? Or would anyone like to create an alternate image that can be used? My own preference is 3, because although 4 is much easier to read, it is a little busy and hydro does not need to be included in the solar article. I have no objection to either 2, 3, or 4 being used. I will not, however ever agree to not including some sort of diagram. Oh yes, I will add that 90% of the energy we use today is wasted, so any minor changes to any of the numbers are totally moot. Apteva (talk) 22:03, 8 October 2008 (UTC)
I just had an idea come to me for a graphic that someone could create, anyone who is good with drawing images. Draw a pallet full of 860 gold bars, on a hoist like they use to unload cargo from a ship, and label it 2,712 ZJ/year, Solar, then a tiny pallet with 9 gold bars on a pallet being unloaded, and label it 27 ZJ/year, Wind, and then a tiny sliver of gold, 1/7th of a bar, on a truck, signifying what we actually use, and label it 0.47 ZJ/year, Consumption. It's a pretty accurate depiction of energy availability, we are smothered in sun and wind and only need a small fraction of what is available to meet all of our needs. Apteva (talk) 06:05, 9 October 2008 (UTC)
- None of the graphics above is correct. 1) has no units, 2)3)4) all have a mismatch between power and energy, and are not drawn to scale. The labeling would need to include qualifiers that show that the solar energy shown is the amount of sunlight striking the earth, which is not the same as the amount of sunlight available for conversion to electricity or other human-usable form of energy. Similar situation with wind. I support the insertion of the information that MrShaba previously had posted. --Skyemoor (talk) 10:35, 9 October 2008 (UTC)
- I don't care about #1 because it has obvious other problems (though having no units is not one of them - the units, TW, are at the bottom of the abscissa, or x-axis for people like me who can't tell which is which), and you may have missed my point that we do not consume energy as if we drank a glass of milk one time only, we consume energy at a rate of use, which is not energy but power, the same as the incoming solar radiation, and I really strongly doubt that you have checked to see if they are drawn to scale (I have), but the ratios could be off by a lot and would be close enough anyway (although as mentioned, bad artwork can be fixed). The description and the caption can be whatever is needed to explain that it is the total energy striking the earth, and any other caveats needed - it isn't the diagram that is wrong. And finally, insertion of information that Mrshaba previously posted doesn't require discussion, just do it. I'm sure that someone will correct the manner in which it is inserted if there is any problem with it. However I can assure you that if it is put in as a table it will be replaced with a diagram, because most people have no clue what numbers mean, but everyone can understand a diagram. Apteva (talk) 14:46, 9 October 2008 (UTC)
Lead section
Please comment on the following two proposed lead sections:
1) http://en.wikipedia.org/w/index.php?title=Solar_energy&oldid=243749995
2) http://en.wikipedia.org/w/index.php?title=Solar_energy&oldid=243775000
Until an agreement has been reached the lead has been reverted to how it existed before the change was proposed.
- Comments
The most obvious problems with #1 are that it is only 2 paragraphs instead of the required 3 or 4, it uses the inaccurate phrase "heat and light" (all energy comes to us from the sun in the form of radiant energy (light) - the sun would have to physically contact the earth for us to directly receive heat from the sun), it includes the inappropriate 99% (99.97%) instead of the word "most", and the second paragraph is a choppy list that includes only a subset of the important ways we use solar energy. The best part of #1 was incorporated into #2, retaining the best parts of the current lead section. Apteva (talk) 02:34, 9 October 2008 (UTC)
- WP:LP does not require 3 or 4 paragraphs. "Heat" is infra-red radiation, which is the energy of electromagnetic waves, but it is simpler for the average user simply to say "heat" in the lede, and delve deeper into the physics later in the article. Notice there was no mention of heat transfer by conduction, in contrast to your comment above. 99.97% is more specific and accurate than 'most', and is therefore much more desirable in WP in order to avoid WP:WW. The list is an overview, as this is a summary section. If you believe there are important items left off, please add them. I have no doubt that #1 can be improved, but #2 is even more awkward, starting with the first sentence; solar energy exists whether it is utilized or not, simply by heating rocks or ocean water. The second paragraph on building design does not flow well, and seems to have too much information for a summary section. --Skyemoor (talk) 20:20, 9 October 2008 (UTC)
- I disagree. WP:LEAD#Length states "The appropriate length of the lead section depends on the total length of the article. As a general guideline, the lead should be no longer than four paragraphs. The following suggestion may be useful: ... > 30,000 characters 3 or 4 paragraphs" Heat is not primarily infra-red radiation. Think of a pot of iron heated to 1,000 degrees. The infra-red radiation it gives off is a small percentage of the heat it contains. The reason for not using a percentage in the lead is the lead is an overall summary, and it isn't the percentage that is important, which is included in the body, it is the concept that is important, that "most" available energy is from solar energy. Remember that numbers mean nothing to most people. I would suggest working on #1 in a sandbox, it has far too many problems to be included. I really don't wish to add to a list of clauses, as sentences are better. The first sentence of the lead has never been something that anyone has been proud of, but "heat and light" is a complete zero. Apteva (talk) 21:43, 9 October 2008 (UTC)
- You can disagree WP:LP does not require 3-4 paragraphs, but you only supplied evidence that says "The following suggestion may be useful". Your comparison of heat from the sun with a the heat contained within a boiling pot has nothing to do with the solar energy that reaches Earth and would be off by many 1000s of orders of magnitude. Working on improving the lede is entirely justifiable; let's do it in a sandbox as you describe and achieve consensus before making changes to the main article. --Skyemoor (talk) 10:38, 10 October 2008 (UTC)
- The article has to be accessible to readers with a scientific/technical background and those without any such background at all. It will be extensively used for school projects but it should also provide good links for energy professionals. We all know that if we stand in the sunshine we can feel the warmth. The heat "comes from the sun". How do we explain this in the article? We have to say something, but I suggest we do it as quickly as possible and use the fact that we can link to other articles for more detail. We might also want to include some of the science in footnotes rather than in the article. Itsmejudith (talk) 10:56, 10 October 2008 (UTC)
- You can disagree WP:LP does not require 3-4 paragraphs, but you only supplied evidence that says "The following suggestion may be useful". Your comparison of heat from the sun with a the heat contained within a boiling pot has nothing to do with the solar energy that reaches Earth and would be off by many 1000s of orders of magnitude. Working on improving the lede is entirely justifiable; let's do it in a sandbox as you describe and achieve consensus before making changes to the main article. --Skyemoor (talk) 10:38, 10 October 2008 (UTC)
- I disagree. WP:LEAD#Length states "The appropriate length of the lead section depends on the total length of the article. As a general guideline, the lead should be no longer than four paragraphs. The following suggestion may be useful: ... > 30,000 characters 3 or 4 paragraphs" Heat is not primarily infra-red radiation. Think of a pot of iron heated to 1,000 degrees. The infra-red radiation it gives off is a small percentage of the heat it contains. The reason for not using a percentage in the lead is the lead is an overall summary, and it isn't the percentage that is important, which is included in the body, it is the concept that is important, that "most" available energy is from solar energy. Remember that numbers mean nothing to most people. I would suggest working on #1 in a sandbox, it has far too many problems to be included. I really don't wish to add to a list of clauses, as sentences are better. The first sentence of the lead has never been something that anyone has been proud of, but "heat and light" is a complete zero. Apteva (talk) 21:43, 9 October 2008 (UTC)
I categorically reject the 3-4 paragraphs nonsense. The lede should be whatever length makes sense. And in general, shorter ledes are always better if they get the point across. We should never be making a lede longer "just because!"
The "heat and light" thing is more interesting. I disagree that heat is inherently inaccurate, because radiant heat is still called heat by a lot of people. I see your point that you want to distinguish it from conduction or convection, though. My proposal would be to replace "heat and light" with "light and radiant heat". It still rolls off the tongue easily; it is technically correct; and, since casual readers will tend to gloss over the word "radiant", I think it is still clear to the layman. I'm going to be bold and make the change, though I recognize with the recent history of this article I might get quickly reverted ;) Oh well...
The other points will require closer inspection. --Jaysweet (talk) 15:45, 10 October 2008 (UTC)
- I am a big fan of semicolons (as, coincidentally, my previous post demonstrates!) but the semicolons in paragraph 2 were not necessary, and arguably not appropriate. None of the individual clauses contained a comma, therefore there was no need to promote the separator from a comma to a semicolon in order to disambiguate clause delineations from subclause delineations. Commas will do just fine.
- I share some of Apteva's skepticism about the value of this list to the lede. I might prefer to be more general in the lede, perhaps with something like (just brainstorming here):
- Solar energy can be used directly, for example in passive heating systems, or it can be converted to electricity via solar cells and other related technologies.
- That sort of gives the flavor without being a tedious list. Comments? --Jaysweet (talk) 15:51, 10 October 2008 (UTC)
- Wikipedia good articles
- Engineering and technology good articles
- Old requests for peer review
- GA-Class physics articles
- Mid-importance physics articles
- GA-Class physics articles of Mid-importance
- GA-Class energy articles
- Top-importance energy articles
- GA-Class Environment articles
- Unknown-importance Environment articles
- Wikipedia pages with to-do lists