Echelle grille

Échelle gratings are special diffraction gratings that have great diffraction efficiencies in high diffraction orders. Blaze grids with high blaze angles of approx. 60–75 ° are typically used . In contrast to conventional diffraction gratings, Échelle gratings have relatively few furrows, around 20–100 per millimeter for visible light.
Origin of the term
The word comes from French: échelle = (rung) ladder, stairs. There are two explanations for the name: the grating itself resembles a staircase, and the individual lines of an Échelle spectrogram are parallel like the rungs of a ladder.
The Échelle spectrograph

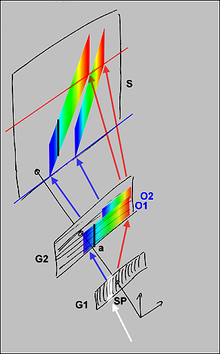
The drawing shows the basic structure of an Échelle spectrograph. The light hits a gap from below with a downstream optical Échelle grating G1 . The dispersion spectrum falls on a conventional grating G2 . The blue and red arrows indicate the position of the diffraction spectrum. The Échelle grating is operated in high diffraction orders, which for the most part coincide with one another. The figure shows two orders O1 and O2 as an example . In fact, the colors mix. If you were to insert a screen at this point, you would see a white spectral thread, not the spectral colors.
The grid G2 is oriented at right angles to the Échelle grid G1 and separates the orders. The spatial division by G1 continues in G2 . Instead of a continuous spectrum that spreads from top (red line) to bottom (blue line) over the entire screen S , a spectral band appears which is limited by the width of G2 . The left blue arrow on S marks the short-wave edge for order O1 , the left red arrow the long -wave edge . The other two arrows point to the band that the grating G2 produces for the second order O2 .
The second optical grating separates the superimposed diffraction orders generated by the Échelle grating. An Échelle spectrum consists of diffraction bands running almost parallel. With increasing order, the diffraction spectra are compressed, which leads to a tilting of the bands on the screen. The drawing exaggerates the effect. If a prism with non-constant dispersion is selected for separation instead of a diffraction grating G2 , the bands on the screen are not linear but curved.
application areas
Échelle gratings are often used in astronomy for recording star spectra with high resolution, because a high-resolution spectrum with a very large wavelength range can be recorded at once. In contrast, conventional high resolution diffraction gratings are optimized for a relatively narrow area; in addition, very long CCD sensors or several CCDs arranged next to one another would be necessary to cover the complete spectrum of the first (or second) order. With the Échelle spectrograph, the spectrum can be recorded with a comparatively small square CCD.
Échelle spectrometers achieve good spectral resolving power with a compact design. A grid / grid, but more often a grid / prism combination is used. As a diffraction grating , a so-called Echelle grating with high efficiency is used in high diffraction orders. In sequential monochromators , a prism is used to preselect the wavelength range . In the case of polychromators , the different diffraction orders are projected two-dimensionally into the surface with a second grating or a prism. As a recipient commercial are photographic plates , secondary electron multiplier behind slit masks and semiconductor area detectors used.
Échelle spectrometers are often used in analytical chemistry for the quantitative and qualitative determination of elements , especially in optical ICP emission spectrometry (ICP-OES) and gas chromatography (see Echelle plasma emission detector ). The good spectral resolution in the UV range for separating the line-rich ICP spectra is particularly effective in this combination.
literature
- Thomas Eversberg, Klaus Vollmann: Spectroscopic Instrumentation - Fundamentals and Guidelines for Astronomers. Springer, Heidelberg 2014, ISBN 3662445344
See also
- Atomic spectroscopy
- Virtually Imaged Phased Array (VIPA) , has similar optical properties as an Échelle grating, but is operated in transmission