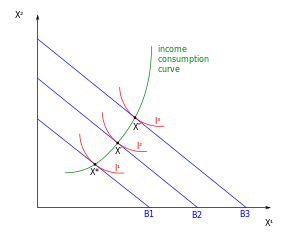
Income-Consumption Curve
The income-consumption curve ( EKK for short ), also known as the income expansion path , is used in economics and especially in microeconomics to denote the geometric location of all household optima that are obtained if all goods prices are kept constant, but the level of household income varies.
definition
Formally
Refers to the Marshallian demand for the goods at prices with a household income of y. Now consider special Marshall's inquiries that satisfy the additional condition that the prices are left constant, that is . If one takes into account the definition of Marshall's demand, this means that a bundle of goods lies on the income-consumption curve if and only if there is a positive income y with which:
Illustrative (two-goods case)
- Optimal bundles of goods
Two goods are considered whose prices are assumed to be constant. If one first considers a certain income level y, then one can determine an optimal combination of these two goods if one knows the preferences of the consumer. This is done graphically by first drawing the budget line associated with the household budget in an x 1 -x 2 diagram . All combinations of quantities of good 1 and good 2, which completely exhaust the consumer's disposable income, lie on it. Then you can draw some indifference curves : on these are all combinations of quantities of good 1 and good 2, the consumption of which results in an equally high benefit for the household . Although there are an infinite number of indifference curves, ultimately only those are of interest that are as high as possible (in the sense of: far from the origin) - this corresponds to the assumption of unsaturation (“more is better”). If a budget line is given, then only the indifference curve that touches the budget line is of interest. The point of contact between the indifference curve and the budget line is then the optimum combination of quantities that the household can ask for with a given budget.
- Construction of the income-consumption curve
If you now change your income, a new budget line is created; Obviously, the higher the disposable income, the further away a budget line is from the origin. The transition from budget line B 1 to B 2 in Fig. 1 thus marks, for example, an increase in income. For this new budget line there is in turn a new “highest” indifference curve, which leads to a new point of contact. If you carry out this procedure not only for two income levels, but for all income levels and always leave the prices of the goods unchanged, then you can combine the resulting utility-maximizing points of contact with one another to form a curve - the income-consumption curve .
Course of the income-consumption curve
Consider the income-consumption curve in the two-goods case. The income-consumption curve rises when both goods are normal , i.e. when an increase in income leads to increased demand for the respective goods (see Fig. 1). On the other hand, it falls if one of the goods is an inferior good (Fig. 2). (A good is called inferior if demand falls [in absolute terms] with increasing income.)
With perfect substitutes , the income-consumption curve is a straight line, the position of which only depends on which of the two goods is more expensive. For example, if the price of good 1 (which is plotted on the horizontal axis) is lower than that of good 2, then every increase in income flows exclusively into additional consumption of good 1; the resulting income-consumption curve is a horizontal line on the x 1 axis (Fig. 3). With perfect complements , the income-consumption curve is a straight line through the origin (with a positive slope); if the axes operate with identical units, it is even a 45-degree line (Fig. 4). The reason for this is that with complements it is optimal to always consume the same amount of each of the two goods.
This can be generalized. If the preferences of the household under consideration are homothetic (as in the special case with perfect substitutes / complements), then the income-consumption curve is a straight line through the origin .
Connection to the Engel curve
The Engel curve can be derived from the income-consumption curve . In graphical terms, one only has to note the disposable income belonging to the respective budget line and transfer it together with the optimally consumed amount of good 1 in an x 1 -y diagram. The resulting curve is called the Engel curve.
See also
literature
- Friedrich Breyer: Microeconomics. An introduction. 5th edition. Springer, Heidelberg a. a. 2011, ISBN 978-3-642-22150-7 . [Chapter 4.3.3.2]
- Jochen Schumann, Ulrich Meyer and Wolfgang Ströbele: Basics of the microeconomic theory. 9th edition. Springer, Heidelberg u. a. 2011, ISBN 978-3-642-21225-3 . [Chapter 4.b]
- Hal Varian : Intermediate Microeconomics. A modern approach. 8th edition. WW Norton, New York and London 2010, ISBN 978-0-393-93424-3 . [Chapter 6.2]


