Angel curve

In economics, and especially in microeconomics , the Engel curve denotes a mathematical function that - based on a certain good - indicates for each income level how many units a consumer should ideally ask for of this good.
The Engel curve is named after the statistician Ernst Engel (1821-1896), who examined the relationship between the expenses a household spends on food and household income (the relationship found is known in the literature as Engel's law ).
construction
The Engel curve is based on the so-called income-consumption curve (also: income expansion path). The income-consumption curve shows - assuming the two-goods case - in an x 1 -x 2 diagram, all combinations of goods that are optimal (i.e., maximizing utility) for a certain income level . The income-consumption curve results from the fact that given the prices of goods and given preferences, the household's available income is varied, the resulting optimum is drawn in and a corresponding curve is constructed from all the optimum points obtained.
In contrast, the Engel curve does not indicate a relationship between good 1 and good 2, but between the amount of a good and the disposable income. To get it, one just needs to match the corresponding coordinate of each point on the income-consumption curve with the income level from which it arose. The pairs (y, x 1 ) and (y, x 2 ) resulting from this are then transferred to a separate graph; their connection results in the angel curve.
Basically, income is plotted on the horizontal axis. The axes are rotated regularly for reasons of graphic construction.
course
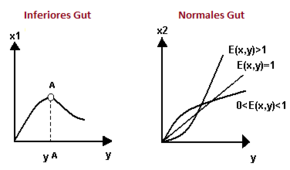
The course of the Engel curve shows directly whether a good is a normal good - i.e. H. a good whose demand increases with an increase in income - or an inferior good - one whose demand decreases with an increase in income - trades. In the first case, the Engel curve is a rising function, in an inferior good it falls. Fig. 2 distinguishes between the following cases:
- Inferior good: The Engel curve falls in income (in the graph to the right of y A is the inferior area); the income elasticity is negative.
- Normal good: The Engel curve rises in income; the income elasticity is positive.
- Luxury goods: The Engel curve is strictly convex (an increase in income of 1% increases the demand for goods by more than 1%); the income elasticity is greater than 1.
- The Engel curve is a straight line through the origin , that is, the demand is proportional to the income (an increase in income by 1% increases the demand for goods by exactly 1%); the income elasticity is 1.
- Necessary goods: The Engel curve is strictly concave (an increase in income of 1% increases the demand for goods by less than 1%); the income elasticity is between 0 and 1.
See also
literature
- Friedrich Breyer: Microeconomics. An introduction. 5th edition. Springer, Heidelberg a. a. 2011, ISBN 978-3-642-22150-7 .
- Arthur Lewbell: Angel curve. In: Steven N. Durlauf and Lawrence E. Blume (Eds.): The New Palgrave Dictionary of Economics. 2nd Edition. Palgrave Macmillan 2008, doi : 10.1057 / 9780230226203.0476 (online edition).
- Hal Varian : Intermediate Microeconomics. A modern approach. 8th edition. WW Norton, New York and London 2010, ISBN 978-0-393-93424-3 .