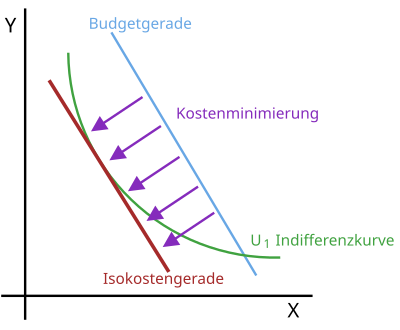
Isocost line
In microeconomics , the isocost line (isocost line) in the factor diagram is the geometric location of all combinations of factor sets that lead to equally high costs. What is represented by the isocost line in production theory can be compared with the balance line in household theory.
The position of the isocost line is determined by the (given) costs and the factor prices. The isocost line is an important aid in determining the minimum cost combination . The term isotime is also used for the isocost line .
Calculation of the isocost line / straight line
When calculating the isocost line, the specified price of a production factor combination (example: 300 monetary units, MU, for 100 tables) is determined by the respective prices of the factors operating resources, i.e. capital (example: 100 MU per ME, unit of measure) and labor (example: 200 GE per ME). The fact with the tables is only indirectly important, since it is only about the costs, not the output that results from the combinations (see isoquants). The abscissa value (x-axis) results from the value of the equipment factor and the ordinate value (y-axis) results from the work factor (example: 300: 100 = 3, so for 3 the abscissa segment is; 300: 200 = 1, 5, so 1.5 is the ordinate segment. The line that can be drawn from 3 on the x-axis to 1.5 on the y-axis would then be the isocost line).
