List of winter storms in the United States according to the Northeast Snowfall Impact Scale
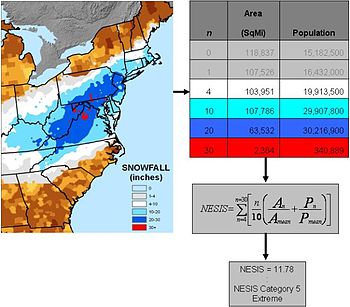
This list of winter storms in the United States on the Northeast Snowfall Impact Scale identifies the winter storms in the United States that have been rated on the Northeast Snowfall Impact Scale (NESIS). This scale is used to classify winter storms in the northeastern United States . The scale was developed by meteorologists Paul Kocin and Louis Uccellini. It ranges from category 1 (“notable”) to category 5 (“extreme”). Only two blizzards , the 1993 Storm of the Century and the 1996 North American Blizzard, are classified as Category 5 "extreme" events. In contrast to the Saffir-Simpson hurricane wind scale and the Fujita scale , which are used to classify tropical cyclones or tornadoes , NESIS takes into account the number of inhabitants of a region who are affected by the storm. This scale is therefore intended to evaluate past storms and is not very suitable for use in weather forecasts.
List of events
There are sometimes two different NESIS values for past storms, on the one hand the values calculated by Paul Kocin and Louis Uccellini, which they calculated in 2004 for their work A Snowfall Impact Scale Derived From Northeast Storm Snowfall Distributions , and on the other hand those based on other data and Methodologies deviating values that the National Climatic Data Center (NCDC) calculated in 2005 for storms that Kocin / Uccellini had not taken into account. Kocin / Uccellini originally considered NESIS values for 70 storms from the period between 1888 and 2003. The NCDC determined NESIS values for 30 of these storms and storms after 2003.
The following list shows the values and ratings of Kocin / Uccellini for storms prior to 2005, while ratings from the NCDC are used from 2005 onwards. If calculated by the NCDC, their index values are also given for storms before 2005.
| date | Original NESIS | NCDC-NESIS | category | classification |
|---|---|---|---|---|
| March 11-14, 1888 | 08.34 | - | 4th | Crippling |
| February 11-14, 1899 | 08.11 | - | 4th | Crippling |
| January 27-28, 1922 | 03.63 | - | 2 | Significant |
| December 26-27, 1947 | 03.50 | - | 2 | Significant |
| February 16-17, 1952 | 02.17 | - | 1 | Notable |
| March 16-17, 1956 | 02.93 | - | 2 | Significant |
| March 18-19, 1956 | 02.23 | 01.87 | 1 | Notable |
| 3rd to 5th December 1957 | 01.32 | - | 1 | Notable |
| February 14-17, 1958 | 05.98 | 06.25 | 3 | major |
| March 18-21, 1958 | 03.92 | 03.51 | 2 | Significant |
| March 12-13, 1959 | 03.64 | - | 2 | Significant |
| February 14-15, 1960 | 04.17 | - | 3 | major |
| March 2-5, 1960 | 07.63 | 08.77 | 4th | Crippling |
| December 11-13, 1960 | 04.47 | 04.53 | 3 | major |
| January 18-21, 1961 | 03.47 | - | 2 | Significant |
| February 2-5, 1961 | 06.24 | 07.06 | 4th | Crippling |
| December 23-25, 1961 | 01.37 | - | 1 | Notable |
| February 14-15, 1962 | 01.59 | - | 1 | Notable |
| March 6-7, 1962 | 02.76 | - | 2 | Significant |
| December 22-23, 1963 | 03.17 | - | 2 | Significant |
| January 11-14, 1964 | 05.74 | 06.91 | 3 | major |
| February 19-20, 1964 | 02.39 | - | 1 | Notable |
| January 16-17, 1965 | 01.95 | - | 1 | Notable |
| 22nd to 23rd 1966 | 04.45 | - | 3 | major |
| January 29th to 31st, 1966 | 05.19 | 05.93 | 3 | major |
| December 23-25, 1966 | 03.79 | 03.81 | 2 | Significant |
| February 5-7, 1967 | 03.82 | 03.50 | 2 | Significant |
| March 21-22, 1967 | 01.20 | - | 2 | Significant |
| February 8-10, 1969 | 03.34 | 03.51 | 2 | Significant |
| February 22-28, 1969 | 04.01 | 04.29 | 3 | major |
| December 25-27, 1969 | 05.19 | 06.29 | 3 | major |
| December 31, 1970 to January 1, 1971 | 02.10 | - | 1 | Notable |
| March 3-5, 1971 | 03.73 | - | 2 | Significant |
| November 25-27, 1971 | 02.33 | - | 1 | Notable |
| February 18-20, 1972 | 04.19 | 04.77 | 3 | major |
| January 16-18, 1978 | 04.10 | - | 3 | major |
| January 19-21, 1978 | 05.90 | 06.53 | 3 | major |
| February 5-7, 1978 | 06.25 | 05.78 | 4th | Crippling |
| February 17-19, 1979 | 04.42 | 04.77 | 3 | major |
| January 13-15, 1982 | 03.08 | - | 2 | Significant |
| April 6-7, 1982 | 03.75 | 03.35 | 2 | Significant |
| February 10-12, 1983 | 06.28 | 06.25 | 4th | Crippling |
| March 8th to 9th, 1984 | 01.29 | - | 1 | Notable |
| March 28-29, 1984 | 01.86 | - | 1 | Notable |
| January 1-2, 1987 | 02.26 | - | 1 | Notable |
| January 21-23, 1987 | 04.93 | 05.40 | 3 | major |
| January 25-26, 1987 | 01.70 | 01.19 | 1 | Notable |
| February 22-23, 1987 | 01.46 | 01.46 | 1 | Notable |
| January 7th to 8th, 1988 | 04.85 | - | 3 | major |
| December 26-27, 1990 | 01.56 | - | 1 | Notable |
| December 10-12, 1990 | 03.10 | - | 2 | Significant |
| March 12-14, 1993 | 12.52 | 13.20 | 5 | Extremes |
| 3rd to 5th January 1994 | 02.87 | - | 2 | Significant |
| February 8-12, 1994 | 04.81 | 05.39 | 3 | major |
| March 2-4, 1994 | 03.46 | - | 2 | Significant |
| February 2-4, 1995 | 03.51 | 01.43 | 2 | Significant |
| December 19-20, 1995 | 03.32 | - | 2 | Significant |
| January 6-8, 1996 | 11.54 | 11.78 | 5 | Extremes |
| February 2-4, 1996 | 02.03 | - | 1 | Notable |
| February 16-17, 1996 | 01.65 | - | 1 | Notable |
| March 31 to April 1, 1997 | 02.37 | 02.29 | 1 | Notable |
| March 14-15, 1999 | 02.20 | - | 1 | Notable |
| January 24-26, 2000 | 03.14 | 02.52 | 2 | Significant |
| December 30th to 31st | 02.48 | 02.37 | 1 | Notable |
| March 3-5, 2001 | 03.53 | - | 2 | Significant |
| December 4-5, 2002 | 01.99 | - | 1 | Notable |
| December 24-25, 2002 | 04.42 | - | 3 | major |
| 3rd to 4th January 2003 | 02.65 | - | 2 | Significant |
| March 6-7, February 2003 | 01.18 | - | 1 | Notable |
| February 15-18, 2003 | 08.91 | 07.50 | 4th | Crippling |
| January 21-24, 2005 | - | 6.80 | 4th | Crippling |
| February 12-13, 2006 | - | 04.10 | 3 | major |
| February 12-15, 2007 | - | 05.63 | 3 | major |
| March 15-18, 2007 | - | 02.54 | 2 | Significant |
| March 1-3, 2009 | - | 01.59 | 1 | Notable |
| December 18-21, 2009 | - | 03.99 | 2 | Significant |
| February 4th to 7th, 2010 | - | 04.38 | 3 | major |
| February 9-11, 2010 | - | 04.10 | 3 | major |
| February 25-27, 2010 | - | 05.46 | 3 | major |
| December 26-27, 2010 | - | 04.92 | 3 | major |
| January 9-13, 2011 | - | 05.31 | 3 | major |
| January 26-27, 2011 | - | 02.17 | 1 | Notable |
| February 1st to 3rd, 2011 | - | 05.30 | 3 | major |
| October 28-30, 2011 | - | 01.75 | 1 | Notable |
| February 7-10, 2013 | - | 04.35 | 3 | major |
| March 4-9, 2013 | - | 03.05 | 2 | Significant |
| December 13-16, 2013 | - | 02.95 | 2 | Significant |
| December 30, 2013 to January 3, 2014 | - | 03.31 | 2 | Significant |
| January 20-22, 2014 | - | 01.26 | 1 | Notable |
| January 29 to February 4, 2014 | - | 04.08 | 3 | major |
| February 11-14, 2014 | - | 05.28 | 3 | major |
| November 26-28, 2014 | - | 01.56 | 1 | Notable |
| December 9-14, 2014 | - | 01.49 | 1 | Notable |
| January 25-28, 2015 | - | 02.62 | 2 | Significant |
| January 29th to February 3rd, 2015 | - | 05.42 | 3 | major |
| February 8-11, 2015 | - | 01.32 | 1 | Notable |
| January 22nd to 24th, 2016 | - | 07.66 | 4th | Crippling |
| March 12-15, 2017 | - | 05.03 | 3 | major |
| 3rd to 5th January 2018 | - | 02.27 | 1 | Notable |
| March 1st to 3rd, 2018 | - | 01.65 | 1 | Notable |
| March 5th to 8th, 2018 | - | 03.45 | 2 | Significant |
| March 11-15, 2018 | - | 03.16 | 2 | Significant |
| March 20-22, 2018 | - | 01.63 | 1 | Notable |
See also
- Regional Snowfall Index
- List of winter storms in the United States with Regional Snowfall Index Category 5
- Saffir Simpson hurricane wind scale
supporting documents
- ^ Staff Writer: Scientists devise new scale to rate snowstorms , The Reading Eagle . February 1, 2006. Retrieved March 1, 2010.
- ↑ The Northeast Snowfall Impact Scale (NESIS) ( English ) National Climatic Data Center (NCDC). Archived from the original on January 5, 2011. Retrieved January 8, 2018.
- ↑ Kocin and Uccellini, pp. 269-270
literature
- Paul J. Kocin, Louis W. Ucellini: A Snowfall Impact Scale Derived From Norheast Storm Snowfall Distributions ( English , PDF, 3.2 MB) National Climatic Data Center (NCDC). 2004. Retrieved January 8, 2018.
- Michael F. Squires, Jay H. Lawrimore: Development of an Operational Northeast Snowfall Impact Scale ( English , PDF, 2.3 MB) National Climatic Data Center (NCDC). 2006.
- The Northeast Snowfall Impact Scale (NESIS) ( English ) National Climatic Data Center (NCDC). Retrieved January 8, 2018.
