
Eye diagram
An eye diagram is a graphic representation of electrical signal curves, with the help of which the signal quality of a digital data transmission can be assessed. It is created by graphically superimposing several measurements of the same signal at different times. To do this, the data stream is divided into equally long sections that are a multiple of the symbol duration . These are displayed one above the other using a luminescent oscilloscope or storage oscilloscope. A kind of summation of the statistically distributed, possible signal curves is thus created on the screen. By the influences to which the signal is subjected to the theoretically infinite steep transitions run from 0 to 1 and vice versa not mathematically rectangular or constant in the same place, but as a more or less wide smeared ramps, making the center the typical shape of the eye is created .

The vertical eye opening shows whether transmission is even possible and how sensitive the transmission is to interference. If the eye is closed, no signal reconstruction by a simple threshold value detector is possible. If the transmission disturbances can be predicted because they are causal and deterministic, the signal can still be received through equalization.
The horizontal eye opening indicates the time range in which a sampling (evaluation) of the logical current state is possible and is limited , among other things, by the symbol crosstalk. If the phase relationships are not clear due to jitter or if they change too much, the eye closes (second picture from right). Even with the eye still open, detection can be impossible if the levels are not as high as necessary to control the next stage.

Eye diagram of an optimized digital output (1024 measurements, 240 MHz, SSTL)

Eye diagram of a binary signal

Eye diagram of a binary signal deteriorated by intersymbol interference
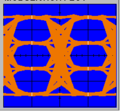
Eye diagram of a signal with four possible levels


literature
- Karl-Dirk Kammeyer : message transmission . 4th revised and supplemented edition. Vieweg + Teubner, Wiesbaden 2008, ISBN 978-3-8351-0179-1 .
- Hermann Weidenfeller: Basics of communication technology . Springer Fachmedien, Wiesbaden 2002, ISBN 3-519-06265-8 .
Web links
- Digital broadcast in baseband (accessed July 30, 2018)
- Impulse interference and equalization methods (accessed July 30, 2018)
- High-speed data transmission over extensive electrical interconnection networks (accessed July 30, 2018)