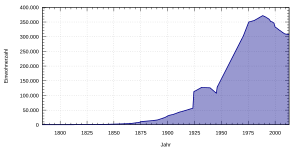
Population development in the city of Katowice
Based on the population development of the city of Katowice , the industrial rise of the city since the middle of the 19th century, the increase in population during the time of the People's Republic of Poland and the decline in Poland due to structural change can be traced.
Population development
Until 1914, when the manor districts of Brynow and Kattowitz-Schloss were incorporated, the increase in population can be attributed exclusively to the emergence or expansion of the core city. The insignificant village in the swampy Rawa valley rose to become one of the most important industrial cities in the Upper Silesian industrial area.
On July 15, 1924, the neighboring municipalities of Bogucice, Brynów, Dąb, Ligota, Załęska Hałda, Załęże and Zawodzie were incorporated, whereupon the population doubled to 112,822 - this made Katowice a major city .
This was followed by further large-scale incorporations and the construction of new large housing estates (see Kattowitz # Incorporation ), whereby the city reached 371,800 inhabitants in 1988. Since the turnaround and the associated structural change, there has been a steady decline in the population. Compared to the peak in 1988, the city has lost a good 20% of its population.
According to a July 2013 report by Gazeta Wyborcza, Katowice had 289,384 permanent residents as of June 30, 2013. This would mean that the city's population would have fallen below 300,000 for the first time and would have been below the level of 1970.
Population numbers
The following table shows the population development of the city of Katowice by area. Some of them are estimates or numbers rounded up.
|
|
swell
- 1783–1861, 1875: Lech Szaraniec: Osady i osiedla Katowic , Artur, Kattowitz 1996, ISBN 83-905115-0-9
- 1817: JC Görlitz: Latest geographical-statistical-technical-topographical description of Prussian Silesia. Glogau 1822
- 1866, 1923, 1924, 1945, 1946 Jerzy Moskal, Wojciech Janota:… Bogucice, Załęże et nova villa Katowice , Śląsk, Kattowitz 1993, ISBN 83-85831-35-5
- 1914, 1939 in the article by Wilhelm Szewczyk
- 1890, 1905, 1931 Michael Rademacher: German administrative history from the unification of the empire in 1871 to the reunification in 1990. sch_kattowitz.html. (Online material for the dissertation, Osnabrück 2006).
- 1900, 1910 gemeindeververzeichnis.de
- 1970 Klaus Ullmann: Silesia Lexicon . Bechtermünz, Augsburg 1996, ISBN 3-86047-184-8
- 1980 Encyclopedia Powszechna PWN
- 1995–2006 official data (main residences) of the Polish Statistical Office (CIS)
