Population development of Rybnik
This article shows the population development of Rybnik in tabular and graphical form.
On June 30, 2016, the official population of Rybnik was 139 540. According to the CIS, Rybnik had the highest population in 1997 with 144 943 inhabitants.
Rybnik remained a small town with fewer than a thousand inhabitants until the 18th century. In Prussian times, Jewish residents also moved to the city. In the 19th century, the city grew from a thousand inhabitants to over 10,000 inhabitants in 1905. With industrialization and incorporation, the number of inhabitants rose in the 1970s to over 100,000. While population growth stopped in most cities in the region at the turnaround, Rybnik continued to grow to its peak until 1997, when the number of inhabitants has fallen.
Population development
- 1581-340
- 1614-484
- 1657-560
- 1725-680
- 1781-789
- 1796-1 190
- 1815 - 1,345 (including 160 Jews)
- 1830-1 844
- 1844-2 437
- 1855-2,907
- 1861 - 3,169 (including 386 Jews)
- 1885-4 081
- 1890 - 5 156 (including 2 200 Poles and 351 Jews)
- 1905-10 445
- 1910-11,656
- 1939 - 30,000
- 1946 - 23 052 (census)
- 1950 - 27,222 (census)
- 1955 - 29,923
- 1960 - 34 099 (census)
- 1961 - 35,200
- 1962 - 35 700
- 1963 - 36,800
- 1964 - 37 500
- 1965-38 178
- 1966 - 38 900
- 1967 - 38 700
- 1968 - 39 400
- 1969 - 40 300
- 1970 - 43 700 (census)
- 1971 - 43 956
- 1972 - 44 400
- 1973 - 61 600 (incorporation of Chwałowice )
- 1974 - 62 700
- 1975 - 102 951 (incorporation of Boguszowice and Niedobczyce )
- 1976 - 103 500
- 1977 - 111 900
- 1978 - 114,600 (census)
- 1979 - 118 200
- 1980 - 122 732
- 1981 - 126 722
- 1982 - 131 234
- 1983 - 133 019
- 1984 - 135 541
- 1985-137 612
- 1986 - 139 215
- 1987 - 140 960
- 1988 ?? - 140,545 (census)
- 1989 - 142,588
- 1990-143,980
- 1991 - 144 765
- 1992 - 143 125
- 1993 - 143 793
- 1994 - 144 020
- 1995 - 144 578
- 1996 - 144 878
- 1997 - 144 943
- 1998 - 144 582
- 1999 - 143 557
- 2000 - 143 218
- 2001 - 142 816
- 2002 - 142,742 (census)
- 2003 - 142 272
- 2004 - 141 755
- 2005 - 141 580
- 2006 - 141 388
- 2007 - 141 080
- 2008 - 141 177
- 2009 - 141 372
- 2010 - 141 036
- 2011 - 140 944 (census)
- 2012 - 140 789
- 2013 - 140 173
- 2014 - 140 052
- 2016 - 139 540 (June 30)
graphic

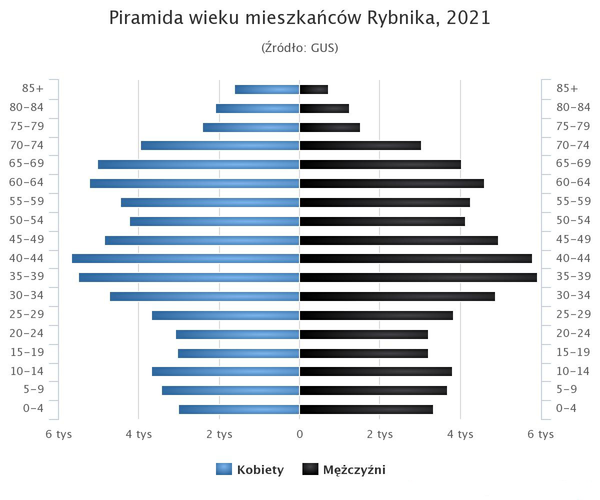
- Age pyramid with the age structure of the city for 2014 (women in blue and men in black):
Urban area
- 1995 - 135.10 km²
- 2001 - 148.26 km²
- 2006 - 148.36 km²
literature
- 1581–1861: Felix Triest: Topographisches Handbuch von Oberschlesien
- 1830, 1844: JG Knie, JML Melcher: Alphabetical-statistical-topographical overview of the villages, towns, cities and other places in the royal family. Prussia. Province of Silesia
- 1939-1979: Roczniki statystyczne GUS
- 1980–1994: Roczniki demograficzne CIS
- 1995–2006: Bank danych regionalnych CIS
- From 2006: “Ludność. Stan i Struktura w przekroju terytorialnym "

