Elliott waves
The Elliott Wave are a means of technical analysis to predict trends in financial markets . The theory was developed in the late 1920s by the American Ralph Nelson Elliott . Elliott tried to take psychological aspects of buyer behavior into account. The Americans Alfred Frost and Robert Prechter contributed significantly to the further development and dissemination of the Elliott wave theory . The Elliott Wave Theory is, in particular, an analysis of market movements in the stock market caused by mass psychology . Like other technical analysis tools, the Elliott wave theory is controversial. Most scientific studies have shown that it is not possible to predict price developments.
Wave theory
Basic concept
Elliott's wave theory is based on the assumption that the collective feelings of investors fluctuate between optimism and pessimism . These fluctuations create patterns. Elliott's theory is that prices fluctuate in five and three waves within a trend . The graphic opposite shows the basic principle. Within the trend, the waves labeled 1, 3, and 5 in the top graph are what are known as drive or motive waves. Waves 2 and 4 are corrective waves. The drive shafts in turn are divided into five waves and the correction waves into three waves. This is how the fractal character is created.
The task of the wave theory is to describe the behavior of the market and only make secondary statements about future developments.
Designations
Since the waves span different time periods due to their fractal nature, Elliott has given these different time periods special names. The standardized designation of the waves is as follows:
| Surname | Period | Drive shafts | Corrective waves |
|---|---|---|---|
| Grand supercycle | Centuries | circled large Roman numerals | circled small letters |
| Supercycle | Decades (40-70) | parenthesized large Roman numerals, e.g. B. (I), (II) | small parenthesized letters, e.g. B. (a), (b) |
| Cycle | a year to decades | stand-alone large Roman numerals, e.g. B. I, II | isolated small letters, e.g. B. a, b |
| Primary | Months to years | circled Indian numerals | circled large letters |
| Intermediate | Weeks or months | bracketed Indian digits, e.g. B. (1), (2) | parenthesized capital letters, e.g. B. (A), (B) |
| Minor | Weeks | Indian numerals, e.g. B. 1, 2 | large letters, e.g. B. A, B |
| minute | Days | circled small Roman numerals | circled small letters |
| Minuette | Hours | parenthesized small Roman numerals, e.g. B. (i), (ii) | small parenthesized letters, e.g. B. (a), (b) |
| Subminuette | Minutes | small Roman numerals, e.g. B. i, ii | small letters, e.g. B. a, b |
Motifs waves
The motive waves include the impulse waves and the diagonal triangles.
Impulse waves
An impulse wave moves in five waves. Waves 1, 3 and 5 represent motive waves, as do waves 2 and 4 corrective waves.
The following rules apply to the identification of impulse waves:
- Wave 4 must not overlap with wave 1.
- Wave 3 is never the shortest.
- Wave 2 must not run below the starting point of wave 1.
If a chart formation violates these rules, it is not a valid count for a pulse wave. In this case the method of counting must be corrected or another formation is present.
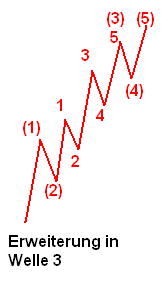
Most impulse waves contain extensions (further subdivisions), which mostly - but not always - take place in wave 3, so that the number of waves increases to nine:
Occasionally it can happen that the shaft 5 is shortened, here the shaft 5 does not exceed the shaft 3:
Diagonal triangles
The diagonal triangles move like the impulse waves in five waves. There are two types of diagonals: the ending diagonal and the leading diagonal.
Ending diagonals are mostly found in wave 5 and rarely in wave C. All waves, including waves 3 and 5, are corrective waves, which results in a 3-3-3-3-3 pattern. The diagonals almost invariably move towards each other:
Leading diagonals occur in wave 1 or wave A (if it is a ZigZag, see below). Here, wave 1 and wave 3 always overlap, and the diagonals move towards each other. In contrast to the ending diagonal, waves 1, 3 and 5 are motif waves, and the result is a 5-3-5-3-5 pattern:
Correction waves
The correction waves move in the opposite direction to the higher trend. There are four main categories: zigzag, flat, triangles and combinations.
Zig Zag
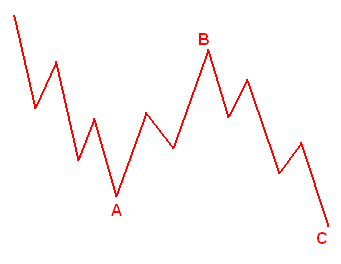
The zigzag is a corrective wave, the three waves are labeled A, B and C. The wave A and the wave C in turn represent a motive wave and the wave B a correction wave, so that a 5-3-5 sequence results against the higher trend. A zigzag moves against the trend with strong energy, as this in turn contains two motive waves.
Wave C must always close below wave A, and wave B must not exceed the beginning of wave A.
In a zigzag, wave B never retraced more than 61.8% of wave A.
A zigzag is shown in the chart as follows:
Sometimes it happens that a zigzag occurs twice in a row. Very rarely does this happen three times in a row. In this case one speaks of a double zigzag. In this case the two zigzags are denoted by W, X and Y. This creates a 5-3-5-3-5-3-5 sequence. This is shown in a chart as follows:
Flat
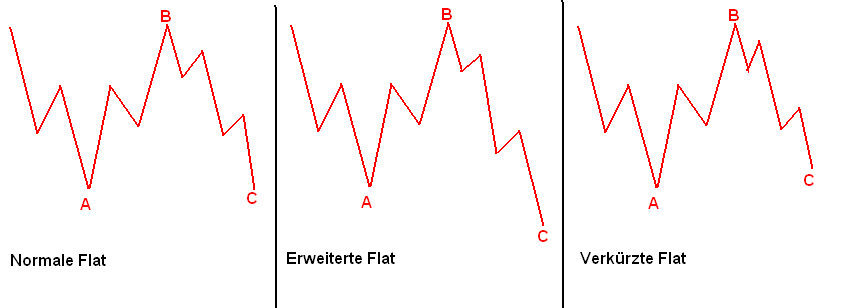
In addition to the zigzag, a flat pattern also often occurs. Wave A and B are corrective waves in this case, in a 3-3-5 sequence. As a result, the Flat is weaker against the trend than the ZigZag. In contrast to the Zigzag, wave C does not have to close below wave A; should this be done anyway, it is referred to as an extended flat rate.
Wave C may end above, this is a shortened flat. A flat is therefore represented in one of the following three formations:
These three types of flats are variants of the normal flat.
Special forms of the flat are those with over- or underflowing wave B. Here, wave B exceeds / overshoots wave A (flat in an upward trend) or falls below / falls below wave A (flat in a downward trend).
After such a wave B, the following wave C can be either very long or very short. A very long wave C (longer than 161.8% of wave A) is called an "irregular flat", and a very short wave C (at least 61.8% of wave B) is called a "running flat".
The retracements of the three waves (ABC) are decisive for a flat rate:
Normal flat (also shortened and extended flat):
- Wave B retraced at least 61.8% of wave A (in contrast to the Zigzag, where wave B must remain above the 61.8% retracement).
- Wave C is never longer than 161.8% of wave A.
- Wave C reaches at least 61.8% of wave B, but mostly 61.8% of wave A.
"irregular Flat":
- Wave B overshoots or undershoots wave A (depending on the trend direction) by a maximum of 61.8%.
- Wave C can reach a maximum of 261.8% of wave A.
The course "punishes" the participants, so to speak, who overshot the target in wave B.
"running Flat":
- Wave B overshoots or undershoots wave A (depending on the trend direction) by a maximum of 61.8%.
- Wave C can only reach at least 61.8% of wave B.
The course "rewards" the participants, so to speak, who saw the trend continuation in wave B with a short and fast wave C.
Another special feature is that wave C can also be an EDT (ending diagonal triangle).
Theoretically, there is the possibility of double flats similar to double zigzag, these are treated by Elliott as normal combinations in "double-three" and "triple-three" (see below) and indicate an extended sideways movement.
Horizontal triangles
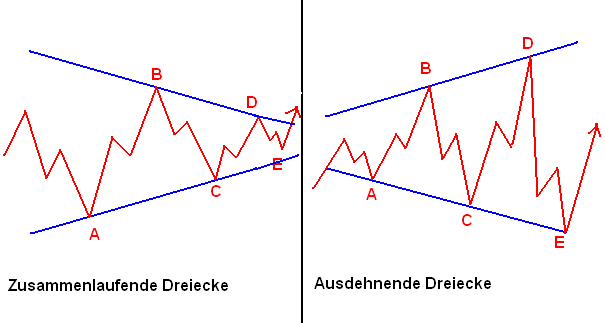
A triangle formation moves in a 3-3-3-3-3 formation with the designations A, B, C, D and E. This formation indicates a balance of forces and the courses move sideways with decreasing volumes. The wave E often does not pay attention to the boundary line and therefore does not have to run up to it, but can also cross it.
There are two types of triangles: converging and expanding triangles.
Expanding triangles are very rare. There are three variants of converging triangles: symmetrical triangles, ascending triangles and descending triangles.
Here is a representation of the triangular formations:
Combinations
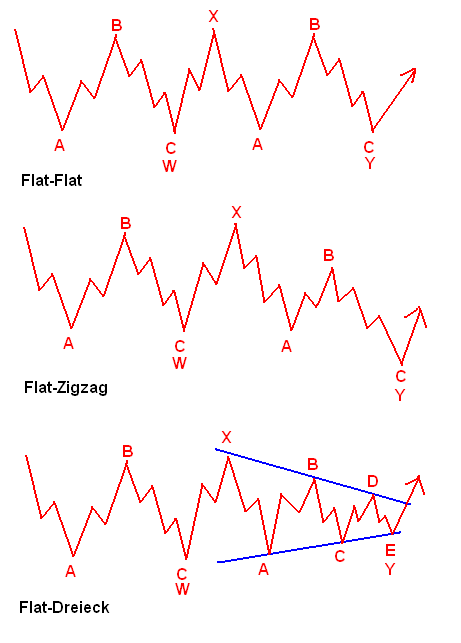
Elliott describes the mostly sideways-running combinations of two or three corrective waves as "double-three" or "triple-three". The waves are associated with the designations W, X, Y and possibly Z. The designation Z only occurs in the case of "triple-three". The individual correction waves are connected with a 3-way formation.
Here are some examples:
The following formations are possible:
- Flat-Flat
- Flat triangle
- Zigzag Flat
- ZigZag triangle
- Flat-Flat-Flat
- Flat-flat triangle
- ZigZag-Flat-Flat
- Zigzag flat triangle
Fibonacci numbers
Elliott's wave theory claims that stock prices are controlled by cycles based on the order of the Fibonacci numbers : 0, 1, 1, 2, 3, 5, 8, 13, 21,….
Accordingly, the markets move in a predetermined number of ups and downs, the waves. Market prices move up in five waves and down again in three waves (5-3 sequence). In a bull market , this simple observation is safe. The first, third and fifth waves are called impulse waves. In a bear market , the market does the opposite, with five waves down and three corrections up.
reception
In the economic literature, this wave theory is nevertheless very controversial, since a linear mechanism of price development can obviously not be proven with this clarity. In contrast, the psychological factor of buyer behavior is undisputed.
The Elliott Wave Theory experienced a scientific revival with the discovery of the mathematical phenomenon of fractals in the late 1970s. Here, too, the question arises whether there is again a shortened analogy from mathematical regularities to social phenomena.
Above all, the accurate forecast of the stock trader Robert Prechter from 1978 for a general bull market up to the mid-1980s and the subsequent crash of 1987 could at least increase the reputation of this theory with at least some of the stock exchange traders and business journalists.
From the point of view of chaos theory, the 5-3 sequences, which - as is usual with fractals (see Mandelbrot fractal ) - in the sense of self-similarity in different orders of magnitude (corresponds to time segments: minutes, hours, days, weeks, months, Years, etc.), interpret it as a market fractal.
Recent research has shown that market fractals of stock indices can be used as a measure of a country's social and historical development. Historical developments and events therefore represent endogenous mood fluctuations in societies in the mass psychological sense that cannot be influenced by external events. If the Elliott waves are correctly evaluated, it should be possible, within certain limits, to make predictions about the further historical, societal and social development of a country. This branch of history or social science is called socionomics .
literature
- Prechter, Robert and Frost, AJ (2004): The Elliott Wave Principle. Key to profit in the market. Munich: FinanzBook Verlag, p. 327 ISBN 3-89879-038-X
- Ströer, Walter J. (1988): The Language of Markets. Elliott waves; Structure for the future. Break: Verlag Language of Markets, 230 pp., 96 graph. Darst. ISBN 3-9801956-0-0
- Maass, Rüdiger (2011): Elliott waves; Make reliable forecasts in every market situation. Munich: FinanzBook Verlag, 232 pp., ISBN 978-3-89879-338-4
- Tiedje, André (2010): Elliot waves are easy to understand . Munich: FinanzBook Verlag, 240 p., ISBN 978-3-89879-503-6
Web links
- Homepage of Bob Prechter , editor of the monthly newsletter "The Elliott Wave Theorist" (English)


