Jackson diagram
The Jackson diagram is a method for the structured design of computer programs. It is part of a method that the theorist Michael A. Jackson (* 1936) developed between 1975 and 1979.
Structure and elements
The Jackson diagram represents the draft program in a hierarchical form, similar to an organizational chart . The entire program is broken down in gradual refinement down to the individual functions. The components of the diagram are simple rectangles connected by arrows.
There are only three types of rectangles:
- A rectangle without any further marking indicates a simple function block that is carried out once.
- A rectangle with an asterisk (*) in the upper right corner indicates a function that is run through repeatedly.
- A rectangle with a circle (o) in the upper right corner indicates one of several alternatives.
The program sequence results from the position of the rectangles:
- Rectangles that are subordinate to another rectangle represent a more refined description of the function block in the higher-level rectangle.
- Rectangles that are next to each other in a row and are not marked with a circle represent function blocks that are executed one after the other.
- Rectangles next to each other in a row and marked with a circle represent alternatives, of which only one is possible depending on the given situation.
Jackson provided that the data that a program processes are also represented in this way, so that a relationship between data structures and program flow becomes visible and the program flow is optimally adapted to the data structure.
example
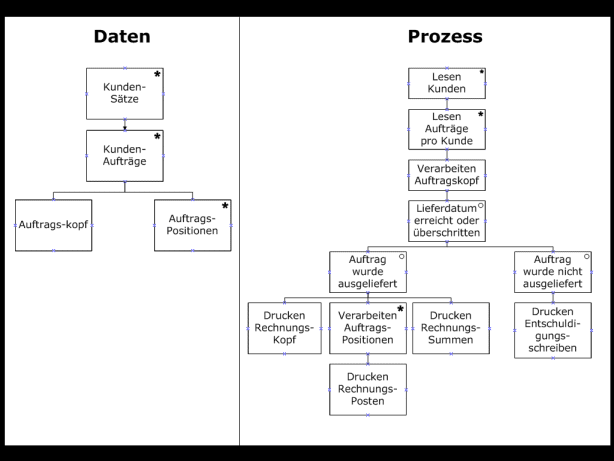
Customers and their orders are stored in a database. Each customer can have multiple orders. Each order consists on the one hand of an order header in which general information about the order is stored, for example the planned delivery date and a Boolean value indicating whether the order has already been delivered. On the other hand, each order includes several order items in which the type, quantity and price of the goods to be delivered are stored.
For every order for which the delivery date has been reached or exceeded, should
- an invoice will be written when the goods have been delivered;
- a letter of apology can be written if the goods have not yet been delivered.
The data from the order items are required to write an invoice. The data from the customer record and the order header are sufficient for the letter of apology.
In this situation the following Jackson diagram shows the data structure and the program flow:
rating
The Jackson diagram is functionally equivalent to the Nassi-Shneiderman diagram to represent the program sequence . The Nassi-Shneiderman diagram grows inwards with refinement, the Jackson diagram grows downwards and outwards. It is just a matter of taste which of the two methods is preferred.
In terms of theoretical computer science, Jackson diagrams are Turing-complete , so that every calculable problem can be mapped with them.
Both methods had their heyday in the 1980s , when structured procedural programming was the technique of choice. With the emergence of object-oriented programming languages such as Java and C ++ since the 1990s , both methods have lost their importance because they cannot adequately map the extended possibilities that these languages offer.
With regard to the representation of data structures, the Jackson method became obsolete shortly after its creation because it could not represent the relational databases that became popular in the 1980s. Other ways of looking at things, in particular the entity relationship model , quickly prevailed against the Jackson method.
literature
- Helmut Balzert: The development of software systems , ISBN 3-411-01618-3 , page 400 ff.
