CUSUM
In statistical process and quality control , the cumulative sum or CUSUM (from English cumulative sum ) is a sequential analysis method to discover changes in a sequential data series or time series (e.g. change of course or turning points ). In 1954, ES Page defined a quality number , a parameter of a probability distribution; z. B. the expected value. He developed CUSUM as a method to filter out general changes in the parameter from random noise and proposed a limit criterion from which the process should be intervened. A few years later, George Alfred Barnard introduced the V-Mask diagram for the visual detection of changes in .
method
CUSUM considers the cumulative sums of data values and given values :
It is important to note that CUSUM is not the mere cumulative sum of the data values, but the cumulative sum of the differences between the data values and . If the value exceeds a specified limit value, then a change has been found. CUSUM not only recognizes sharp changes in data values, but also gradually and continuously over the observation period. Most of the time it is a likelihood function , although this is not specified in Pages articles.
Examples
example 1
In the example, both positive and negative cumulative deviations are specified and considered:
| n | Data value | CUSUM | |||
|---|---|---|---|---|---|
| 0 | 0 | 0 | 0 | ||
| 1 | 2 | −3 | 0 | 3 | −3 |
| 2 | 4th | −1 | 0 | 4th | −4 |
| 3 | 7th | +2 | 2 | 2 | −2 |
| 4th | 3 | −2 | 0 | 4th | −4 |
| 5 | 9 | +4 | 4th | 0 | 0 |
can also be understood:
- All data points are mean-adjusted ( ) and
- For each newly created value, all previous mean-adjusted differences are added.
The mean is the likelihood estimate for the expected value of normally distributed data values.
Example 2
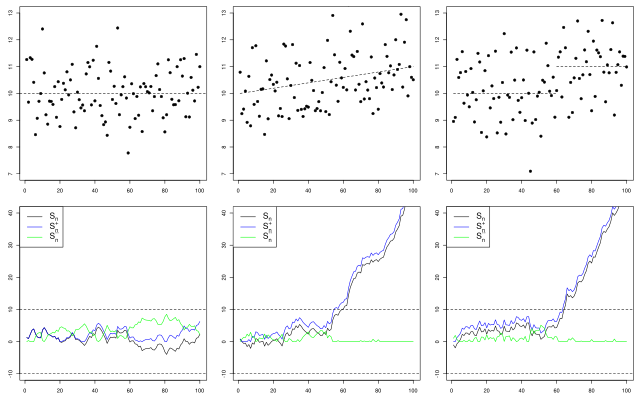
The following graphics show the course of , and in different situations:
- left: the mean value of the process does not change
- middle: the mean value of the process slowly increases (in relation to the variation)
- right : the mean value jumps up abruptly after 60 time units
These changes can hardly be seen in the data (above), but not in the course of the , and curves (below).
literature
- Michèle Basseville, Igor V. Nikiforov: Detection of Abrupt Changes: Theory and Application . Prentice-Hall, Englewood Cliffs, NJ 1993, ISBN 0-13-126780-9 ( irisa.fr ).
- Douglas M. Hawkins , David H. Olwell : Cumulative sum charts and charting for quality improvement Springer Verlag , 1998, ISBN 0-387-98365-1 .
Web links
Individual evidence
- ↑ ES Page: Continuous Inspection Schemes . In: Biometrika . Vol. 41, No. 1/2 (June 1954), ISSN 0006-3444 , pp. 100-115.
- ^ GA Barnard: Control Charts and Stochastic Processes . In: Journal of the Royal Statistical Society. Series B (Methodological) . Vol. 21, No. 2 (1959), ISSN 0035-9246 , pp. 239-271.


