Regression diagnostics
In statistics , regression diagnostics is the test of whether the classic assumptions of a regression model are consistent with the available data. If the assumptions are not correct, the calculated standard errors of the parameter estimates and p values are incorrect. The problem with regression diagnostics is that the classic assumptions only relate to the disturbance variables , but not to the residuals.
Review of the regression model assumptions
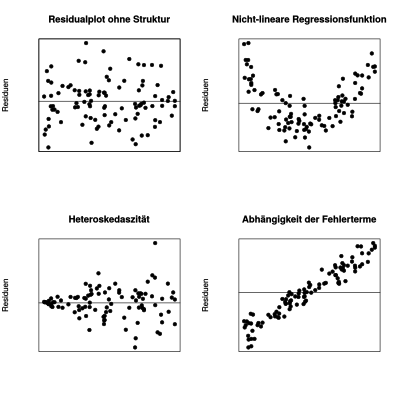
As part of the regression diagnosis, the requirements of the regression model should be checked as far as possible. This includes checking whether the error terms have no structure (which would then not be random). This includes whether
- the error terms are independent,
- Analysis of the variance of the error terms ( homoscedasticity and heteroscedasticity ),
- the error terms normally-distributed and
- no further regressable structure exists in the error terms.
Key figures and tests
Scatter charts, key figures and tests are used for analysis:
- Independence of the error terms
-
- Scatterplots of the residuals ( axis) versus the independent variable, the dependent variable, and / or the estimated regressions
- Durbin-Watson test for autocorrelated error terms
- Heteroscedasticity of the error terms
-
- Scatterplots of the residuals ( axis) versus the independent variable, the dependent variable, and / or the estimated regressions
- Breusch-Pagan test
- Goldfeld-Quandt test
- Normal distribution of the error terms
-
- Deviations from the normal distribution assumption of the error terms can be checked using a normal-quantile diagram or quantile-quantile diagram for the residuals
- Skewness and kurtosis as measures for the asymmetry and curvature of the error distribution. For normally distributed quantities, the skewness is equal to 0 and the kurtosis is equal to 3. If these values differ, there is probably no normal distribution.
- Tests for normal distribution of the residuals: Shapiro-Wilk test , Lilliefors test ( Kolmogorow-Smirnow test ), Anderson-Darling test or Cramér-von-Mises test
- Regressable structure of the error terms
-
- Scatter plot of the (squared) residuals ( axis) including a nonparametric regression against the independent variable, the dependent variable, the estimated regression values and / or the variables not used in the regression
therapy
- Presence of autocorrelation
-
- The generalized least squares method is a solution in the presence of autocorrelation
Runaway
Data values that "do not fit into a series of measurements" are defined as outliers . These values have a strong influence on the regression equation and falsify the result. To avoid this, the data must be examined for incorrect observations. The detected outliers can be eliminated from the measurement series, for example, or alternative outlier-resistant calculation methods such as weighted regression or the three-group method can be used .
In the first case, after the first calculation of the estimated values, statistical tests are used to check whether there are outliers in individual measured values. These measured values are then rejected and the estimated values are calculated again. This method is suitable when there are only a few outliers.
In weighted regression, the dependent variables are weighted depending on their residuals . Outliers, d. H. Observations with large residuals are given a low weight, which can be graded depending on the size of the residual. In the algorithm according to Mosteller and Tukey (1977), which is referred to as “biweighting”, unproblematic values are weighted with 1 and outliers with 0, which means that the outlier is suppressed. With weighted regression, several iteration steps are usually required until the set of identified outliers no longer changes. If the omission of one or a few observations leads to major changes in the regression line, the question arises as to whether the regression model is appropriate.
- Diagnosis: Cook's distance : The Cook's distance measures the influence of the -th observation on the estimation of the regression model.


