
Value Map

The value map (or also value matrix or price-performance matrix) is an instrument for determining the competitive position of products or services. The relative price and relative quality of the product or service are considered and result in the relative price-performance ratio.
Basics
According to Henry Mintzberg, quality is a way of realizing a differentiation strategy . A higher quality results in an increase in the compliance costs, but a decrease in the deviation costs. The two opposing developments mean that additional costs for quality are offset by savings. So has z. For example, the PIMS study showed that an increase in quality does not necessarily mean an increase in direct costs. Since quality prevents commodization, it leads to higher prices and, in the long term, to market share gains. A differentiation strategy based on quality is therefore superior to cost competition. However, quality is far less quantifiable. In addition to the internal technical quality view, there is an external view. On the one hand, quality according to ISO 9000: 2005 is defined as the “degree to which a set of inherent characteristics meets requirements” and, on the other hand, every customer subjectively assesses the quality of a product or service and assesses the “fitness for use” . The value map takes this relativity of the concept of quality into account. In this way, products and services can be assessed for their price-performance ratio relative to their competitors.
Strategic position areas
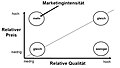
The value map takes into account the relative quality and the relative price in the two-dimensional diagram and defines them as follows:


In the PIMS study , a third possibility of representing relativity is included with perception. This is not considered in the value map.
Finally, there are five strategic positioning areas in the value map:
| Relative quality | Relative price | |
|---|---|---|
| Inferior value for money | low | high |
| Cheap position | low | low |
| Average position | medium | medium |
| Luxury position | high | high |
| Superior price-performance ratio | high | low |
The diagonal, the so-called price-performance straight line, reflects the average competitive behavior. It is a kind of regression line through the product positioning of the market and illustrates the exchange relationship between quality and price. In quality-sensitive markets, the straight line is shifted to the right; that is, it moves at a higher quality level. This means that smaller quality differences lead to larger price differences.
The following behaviors are expressed on the price-performance straight line: Either the company offers a rather low level of quality at low prices, but is accepted by the customer ( cheap position ) or the company demands a high price for top quality ( luxury position ). The third position is the average position , in which the company charges an average price, but the customer is only offered average quality. In addition, the PIMS study revealed two other typical behaviors:
A fourth group of providers demand high prices for quality, which, however, is assessed as low from the customer's point of view. Such an inferior price-performance ratio is offered by i. d. As a rule, companies that do not have sufficient knowledge of customer needs and rather follow internal technical-functional quality standards that are not recognized by customers. Another internal reason could be that the company is currently unable to significantly increase the quality level. The quality is then perceived as worse than the competition. It is also conceivable that companies z. For example, for products that quickly become obsolete and have a short life cycle (e.g. fashion products), pursue a skimming strategy and therefore set prices as high as possible. In this case, the strategy of an inferior price-performance ratio is deliberately pursued.
A fifth group of providers, on the other hand, offers top quality at low prices, which is the strategy of a superior price- performance ratio . According to the PIMS study, these are mainly young, innovative, customer-oriented companies.
Implications
The five different positioning areas have opposing effects on market share, marketing intensity and company profitability. The PIMS study provides specific data in this context.

Comparison of the annual changes in market share
Comparison of marketing intensity
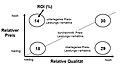
Relationship between price-performance ratio and ROI


In terms of market share, this can be maintained by products in the cheap position, whereas those in the luxury position expand theirs. The positioning areas below and above the price-performance line are really interesting. Products with a superior price-performance ratio increase their market share considerably; those with an inferior price-performance ratio lose significantly.
The marketing intensity is of little interest for the areas on the price-performance straight. Increased marketing efforts must be made for products with an inferior price-performance ratio. As a result, high quality products at low prices require reduced marketing efforts.
With regard to the return, the return on investment (ROI) is highest in the luxury sector and for products with superior price-performance. In the cheap area, significantly lower returns can be achieved, but still higher than with products in the area of an inferior price-performance ratio.
In summary, one can say that products in the luxury sector and with a superior price-performance ratio can be identified as better sector positioning.
Strategy recommendations

Once the product positioning has been identified, specific recommendations for quality strategies can be derived. In addition to the relative quality, these must also be considered with regard to the differentiation of the market. Market differentiation means the extent to which the individual providers differ in terms of product and service. Three quality strategies can be recommended for the specific starting situation.
The catch-up strategy eliminates the quality disadvantage in order to catch up with the competition. This leads to a reduction in market differentiation, which in turn leads to price wars for market share and thus to lower industry returns.
If quality levels are skipped while the market differentiation remains the same, one speaks of the skipping strategy . The return level is maintained here.
If both market differentiation and relative quality are increased, this strategy is referred to as pulling away . An increase in market differentiation can be achieved by e.g. B. Product features are offered which the competing products do not have or which are perceived and evaluated differently by the customer. This often leads to an increase in the return level.
Conclusion
In general, it can be said that there is a positive relationship between market differentiation, relative quality and profitability. With high market differentiation and high relative quality, the highest ROI is achieved, whereas with high market differentiation and a low relative quality level, the same return on investment is achieved as with low differentiation and high relative quality.
literature
- Heinz-Georg Baum; Adolf G. Coenenberg ; Thomas Günther: Strategisches Controlling, Stuttgart, 2007, ISBN 3791025457
- Robert D. Buzzell; Bradley T. Gale: The PIMS Program: Strategies and Business Success , Wiesbaden, 1989, ISBN 3409133437