
Global warming


The current global warming or global warming (colloquially also "the" climate change ) is the increase in the average temperature of the near-earth atmosphere and the oceans since the beginning of industrialization . It is an anthropogenic (= man-made) climate change as it is mainly due to industrial, forest and agricultural activities that emit greenhouse gases .
In contrast to the weather , which describes short-term current conditions of the atmosphere, mean values are recorded for the climate over long periods of time. Normally, normal periods of 30 years are considered. According to the Intergovernmental Panel on Climate Change (IPCC), the rise in temperature from the pre-industrial period up to 2017 was around 1 ° C. 2016 was the warmest year since systematic measurements began in 1880. It was around 1.1 ° C warmer than in pre-industrial times. According to current research, it was this warm last at the end of the Eem warm period115,000 years ago. The 20 warmest measured years are in the last 22 years (as of 2018) and the five warmest years were 2016, 2019, 2015, 2017 and 2018 in descending order.
Warming has accelerated: The rate of increase calculated over the years 1956 to 2005 was 0.13 ± 0.03 ° C per decade, almost twice as great as that over the years 1906 to 2005. In 2017, man-made global warming according to the IPCC was A value of 1 ° C was reached, at that time the growth rate was around 0.2 ° C per decade. The warming proceeds considerably faster than all known warming phases of the modern earth period , i.e. for 66 million years. This is how the earth warms up during the transition from an ice agein an interglacial period around 4 to 5 ° C within approx. 10,000 years. In the case of man-made global warming, without tightened climate protection measures, it is expected that the temperature will rise by 4 to 5 ° C from the end of the 20th to the end of the 21st century; the warming would be about 100 times faster than with historical natural climate changes.
The cause of the warming is the ongoing anthropogenic enrichment of the earth's atmosphere with greenhouse gases , in particular carbon dioxide (CO 2 ), methane and nitrous oxide , which are mainly released through the burning of fossil energy , through deforestation and agriculture and especially animal husbandry. This increases the retention capacity for infrared heat radiation in the troposphere , which increases the greenhouse effect. The most important greenhouse gas in the current global warming is CO 2. In 2015, the mean CO 2 concentration in the earth's atmosphere measured by the Mauna Loa measuring station rose to over 400 ppm for the first time ; before industrialization it was around 280 ppm. The IPCC writes in its fifth assessment report published in 2015that it is extremely likely that humans caused more than 50% of the warming observed from 1951 to 2010. The best estimate is that the human contribution to warming during this period is around 100%. These values are supported by other progress reports. Without the current human influence on the climate system, the slight cooling trend that has prevailed for several millennia would very likely continue.
The atmospheric greenhouse effect was first described by Joseph Fourier in 1824 ; From the 1850s there was further research . In 1896, the chemist and physicist Svante Arrhenius predicted global warming due to the amount of CO 2 emitted by humans . In 1938 Guy Stewart Callendar succeeded for the first time in demonstrating global warming on the basis of temperature measurements. After the Second World War, the topic increasingly moved into the focus of science. The researchers Roger Revelle and Hans E. Suess spoke in 1957 of a gigantic ( large-scale) "Geophysical experiment". From around the 1960s, discussions on the topic of anthropogenic climate change took place at international level. Nathaniel Rich has detailed in his 2019 book Losing Earth how much was known about global warming and its consequences as early as the 1980s. Since around the beginning of the 1990s there has been a scientific consensus that global warming, measured since around 1850 , is caused by humans.
Among the noisy climate research expected and partly already observed consequences of global warming are depending on the Earth region: sea ice and melting glaciers , a rise in sea level , the thawing of permafrost soils with the release of methane hydrate , growing drought areas and increasing weather extremes with corresponding repercussions on the life and Survival situation of humans and animals ( extinction of species ). The extent of the consequences depends on the level and duration of the warming. Some consequences can also be irreversible or also asTilting elements act in the earth system , which in turn accelerate global warming with positive feedback , such as the release of the greenhouse gas methane from the thawed permafrost .
In order to mitigate the consequences of global warming for humans and the environment, national and international climate policy aim both to stop climate change through climate protection and to adapt to the warming that has already occurred. In order to be able to stop man-made global warming, further energy-related greenhouse gas emissions must be completely avoided and the emissions introduced into the atmosphere since the beginning of industrialization as well as unavoidable emissions from negative greenhouse gas emissions by means of suitable technologies such as B. BECCS , DACCS or carbon sequestration in the soilcan be completely undone again. As of 2016 already was about 2 / 3 of the CO 2 Budgeting the maximum possible emissions for the Paris Convention agreed two-degree target used up, so that global emissions be reduced quickly would have if the target is to be reached. It is possible that the two-degree target is not ambitious enough to prevent a state of the climate system known as the greenhouse earth , which would lead to hostile conditions on earth.
Physical basics
Since the industrial revolution , humans have increased the natural greenhouse effect through the emission of greenhouse gases , as has been proven by measurements. Since 1990, radiative forcing - i.e. H. the warming effect on the climate - increased by 43% from persistent greenhouse gases. In climatology there is now consensus that the increased concentration of greenhouse gases released by humans into the earth's atmosphere is very likely to be the most important cause of global warming, since without it the measured temperatures cannot be explained.
Greenhouse gases allow the short-wave radiation from the sun to pass through to the earth largely unhindered, but absorb a large part of the infrared radiation emitted by the earth . As a result, they heat up and even emit radiation in the long-wave range (see Kirchhoff's law of radiation ). The part of the radiation directed towards the surface of the earth is called atmospheric counter-radiationdesignated. In the isotropic case, half of the absorbed energy is radiated towards the earth and half towards space. This causes the earth's surface to heat up more than if the sun's short-wave radiation alone would heat it. The IPCC rates the degree of scientific understanding of the effects of greenhouse gases as "high".
The greenhouse gas water vapor (H 2 O) contributes 36 to 66%, carbon dioxide (CO 2 ) 9 to 26% and methane 4 to 9% to the natural greenhouse effect. The wide range can be explained as follows: On the one hand, there are large fluctuations in the concentration of these gases both locally and temporally. On the other hand, their absorption spectra overlap. Example: Radiation that has already been absorbed by water vapor can be caused by CO 2can no longer be absorbed. This means that in an environment such as ice-covered areas or arid desert, where water vapor contributes little to the greenhouse effect, the remaining greenhouse gases contribute more to the overall greenhouse effect than in the humid tropics.
Since the greenhouse gases mentioned are natural components of the atmosphere, the increase in temperature they cause is known as the natural greenhouse effect . The natural greenhouse effect means that the average temperature of the earth is around +14 ° C. Without the natural greenhouse effect, it would be around −18 ° C. These are calculated values (see also idealized greenhouse model ). In the literature, these values may vary slightly, depending on the calculation approach and the underlying assumptions, for example the reflection behavior ( albedo )the earth. These values serve as evidence that there is a natural greenhouse effect, since without it the temperature would have to be significantly lower and the higher temperature can be explained by the greenhouse effect. Deviations of a few degrees Celsius initially do not play a major role in this verification.
Causes of Man Made Global Warming

The global warming currently observed is almost entirely due to human activity. The probable human contribution to the warming of the period 1951 to 2010 is at least 93% and could be up to 123%, i.e. over 100%, which is possible by compensating for various cooling factors. The main cause is the increasing greenhouse gas concentration in the earth's atmosphere due to human activities. The resulting additional radiative forcing is discussed in the Fifth Assessment Report of the IPCCin 2011 compared to the reference year 1750 net (i.e. after deducting cooling effects such as aerosols) at 2.3 W / m². All long-lived greenhouse gases caused a gross radiative forcing of 2.83 W / m². The most important greenhouse gas was CO 2 with 1.82 W / m², followed by methane with 0.48 W / m². Halogenated hydrocarbons caused a radiative forcing of 0.36 W / m², nitrous oxide 0.17 W / m². Of the short-lived greenhouse gases, ozone , the formation of which is stimulated by nitrogen oxides, carbon monoxide or hydrocarbons, has the highest radiative forcing at 0.4 W / m². Aerosols cause negative (i.e. cooling) radiative forcing of −0.9 W / m².
In contrast, changes in natural solar activity are an insignificant factor in the currently observed global warming. During the same period, solar activity accounted for a radiative forcing of only 0.1 W / m²; solar activity has even declined since the middle of the 20th century.
Increase in the concentration of the most important greenhouse gases


The proportion of all four components of the natural greenhouse effect in the atmosphere has increased since the beginning of the industrial revolution. The rate of increase in concentration is the fastest in 22,000 years.
The concentration of CO 2 in the earth's atmosphere is mainly due to the use of fossil energy, the cement industry and extensive deforestation since the beginning of industrialization from approx. 280 ppmV by 40% to approx. 400 ppmV (parts per million, parts per million by volume ) increased in 2015. During the last 14 million years (since the Middle Miocene ) there were no significantly higher CO 2 values than at present. According to measurements from ice cores , the CO 2 was-Concentration never exceeded 300 ppmV in the last 800,000 years. Around 100 million tons of carbon dioxide are released into the atmosphere every day through human activities (as of 2020).
The volume fraction of methane rose from 730 ppbV in 1750 to 1,800 ppbV (parts per billion) in 2011. This is an increase of 150% and, like CO 2, the highest level in at least 800,000 years. The main cause of this is currently cattle farming , followed by other agricultural activities such as growing rice. The global warming potential of 1 kg of methane over a period of 100 years is 25 times higher than that of 1 kg of CO 2 . According to a more recent study, this factor is even 33 when interactions with atmospheric aerosolsbe taken into account. In an oxygen-containing atmosphere, however, methane is oxidized, usually by hydroxyl radicals . A methane molecule once it has entered the atmosphere has an average residence time of twelve years.
In contrast, the residence time of CO 2 is sometimes in the range of centuries. The oceans absorb atmospheric CO 2 very quickly: a CO 2 molecule is dissolved in the oceans after an average of five years. These are released back into the atmosphere, so that part of the CO 2 emitted by humans ultimately lasts for several centuries (approx. 30%) and another part (approx. 20%) even for millennia in the carbon cycle of the hydrosphere and atmosphere remains.
The volume share of nitrous oxide rose from pre-industrial 270 ppbV to 323 ppbV. With its absorption spectrum, it helps to close a radiation window that is otherwise open to space. Despite its very low concentration in the atmosphere, it contributes around 6% to the anthropogenic greenhouse effect , since its effect as a greenhouse gas is 298 times stronger than that of CO 2 ; in addition, it also has a fairly long atmospheric dwell time of 114 years.
The water vapor concentration in the atmosphere is not significantly changed by anthropogenic water vapor emissions, as additional water introduced into the atmosphere condenses out within a few days. Rising global average temperatures, however, lead to higher vapor pressure, i.e. greater evaporation. The global increase in the water vapor content of the atmosphere is an additional driver of global warming. Water vapor thus essentially acts as a feedback element. This water vapor feedback is, next to the ice-albedo feedback, the strongest, positive feedback in global climate events.
Aerosols
In addition to greenhouse gases, solar activity and aerosols also influence the earth's climate. Of all the identified contributions to radiative forcing, aerosols provide the greatest uncertainty, and the understanding of them is described as "low" by the IPCC. The effect of an aerosol on the air temperature depends on its altitude in the atmosphere. In the lowest layer of the atmosphere, the troposphere , soot particles cause the temperature to rise because they absorb sunlight and then give off thermal radiation . The reduced reflectivity ( albedo) from snow and ice surfaces and subsequently fallen soot particles also have a warming effect. In the higher layers of the air, on the other hand, mineral particles ensure that the earth's surface is cooler thanks to their shielding effect.
A major factor of uncertainty when measuring the climate impact of aerosols is their influence on the cloud formation , which is also not fully understood . Despite the uncertainties, aerosols are considered to have a significantly cooling effect overall. Decreasing air pollution could therefore contribute to global warming.
The decline in global mean temperatures observed between the 1940s and mid-1970s, as well as the temporary stagnation in global mean temperatures after 2000, is largely attributed to the cooling effect of sulfate aerosols, which in the first case occurred in Europe and the USA and in the last case in the People's Republic of China and India were to be located.
Subordinate and incorrectly suspected causes

A number of factors influence the global climate system . In the discussion about the causes of global warming, factors are often mentioned that are subordinate or even have a cooling effect on the climate system. Altered cosmic rays are not responsible for the warming currently observed. The earth has been in a phase of rewarming from the Little Ice Age since around 1850, i.e. since the beginning of the industrial revolution . Regardless of this, without human intervention in the natural climate, the cooling trend of 0.10 to 0.15 ° C per millennium that has existed for 6000 years would continue and - depending on the literature source - lead to a new cold period in 20,000 to 50,000 years.
Ozone hole
The assumption that the ozone hole is a major cause of global warming is wrong. The depletion of ozone in the stratosphere has a slightly cooling effect. The ozone depletion works in two ways: The reduced ozone concentration cools the stratosphere because of the UV radiationis no longer absorbed there, however, warms the troposphere, since the UV radiation is absorbed at the earth's surface and warms it up. The colder stratosphere sends less warming infrared radiation downwards and thus cools the troposphere. Overall, the cooling effect dominates, so that the IPCC concludes that the observed ozone depletion over the last two decades has led to a negative radiative forcing on the climate system, which is around −0.15 ± 0.10 watts per square meter (W / m² ) can be quantified.
Solar activity


Changes in the sun are said to have a minor impact on measured global warming. The change in radiation intensity measured directly from orbit since 1978 is far too small to be the main cause of the temperature development observed since then. Since the 1960s, the course of the global average temperature has been decoupled from the radiation intensity of the sun, since 1978 the reduced radiation intensity has very probably counteracted global warming somewhat.
In 2013, the IPCC estimated the additional radiative forcing by the sun since the beginning of industrialization to be around 0.05 (± 0.05) watts per square meter. In comparison, the anthropogenic greenhouse gases contribute 2.83 (± 0.29) W / m² to the warming. The IPCC writes that the degree of scientific understanding regarding the influence of solar variability has increased from “very low” to “low” from the third to the fourth assessment report. In the fifth assessment report, the IPCC attributes its estimate of the solar radiative forcing since 1750 to "medium informative value"; the informative value has been higher for the last three decades.
Cosmic rays
The argument that cosmic rays increase the effects of solar activity is based on a study by Henrik Svensmark and Egil Friis-Christensen . They assume that cosmic radiation influences the formation of clouds and thus has an indirect influence on the earth's surface temperature. This is to explain how fluctuations in solar activity - despite the only slight change in solar radiation - can trigger the observed global temperature increase. Recent scientific studies, mainly from the CLOUD experiment, however, show that the influence of cosmic rays on cloud formation is small. In its 5th assessment report, published in 2013, the IPCC stated that although there were indications of such a mechanism of action, it was too weak to have a significant impact on the climate. Cosmic rays as a reinforcing factor are also dependent on solar activity and, given its negative trend since the 1960s, could at most have increased a cooling effect.
Volcanic activity
Large volcanic eruptions of the VEI-5 or VEI-6 category on the volcanic explosion index can cause hemispherical or global cooling (around −0.3 to −0.5 ° C) over several years due to the emission of volcanic ash and aerosols into the stratosphere . It is assumed that high volcanic activity, for example, exerted a considerable influence on the temperature development during the Little Ice Age . The effect of volcanic activity has shown a slightly cooling trend over the past 60 years, so it cannot explain the warming either.
It is sometimes argued that the CO 2 emitted by the volcanoes is responsible for the additional greenhouse effect. However, volcanoes only release around 210 to 360 megatons of CO 2 per year . That is about a hundredth of the annual man-made CO 2 emissions. The greatest mass extinction in the history of the earth at the Permian-Triassic border is explained by a strong volcanic greenhouse effect, but at that time it was a megavolcanism that cannot be compared with today's volcanic activity.
Steam
With an atmospheric share of around 0.4%, water vapor is the most powerful greenhouse gas in its overall effect and is responsible for around two thirds of the natural greenhouse effect. CO 2 is the second most important factor and accounts for most of the remaining greenhouse effect. However, the concentration of water vapor in the atmosphere is mainly dependent on the air temperature (according to the Clausius-Clapeyron equationair can absorb around 7% more water vapor per degree Celsius temperature). If the temperature increases due to another influencing factor, the water vapor concentration increases and with it its greenhouse gas effect - which leads to a further increase in temperature. Water vapor thus intensifies the temperature changes triggered by other factors. This effect is called water vapor feedback . Water vapor therefore doubles or triples the warming caused by the increase in CO 2 concentration alone .
Waste heat
Almost all processes generate heat , for example in the production of electrical power, when using internal combustion engines (see efficiency) or when operating computers. In the USA and Western Europe, building heating, industrial processes and combustion engines contributed 0.39 W / m² and 0.68 W / m² to the warming in 2008 and thus have a certain influence on regional climate change. Seen worldwide, this value was 0.028 W / m² (i.e. only about 1% of global warming). Considerable contributions to warming can be expected from the end of our century in the event of a further unchecked increase in energy production (as in previous decades). If one considers the total length of time carbon dioxide remains in the atmosphere, then the radiation forcing caused by the greenhouse effect as a result of the combustion of carbon exceeds the heat released during the combustion process more than 100,000 times.
Urban heat islands
The temperature in cities is often higher than in the surrounding area, due to heatingand industrial processes heat is produced. This is more strongly absorbed in houses and sealed surfaces. The temperature difference in large cities can be up to 10 ° C. Since many temperature measurements are made in cities, this could lead to a virtual increase in global temperature. However, temperature changes and not absolute values are taken into account in measurements of global temperature. In addition, temperature measurements in cities are often carried out on green areas that are cooler due to the greenery. Control calculations of the global temperature with exclusively rural stations result in practically the same temperature trends as the calculation from all stations.
Measured and projected warming

The main indicators of the current global warming are the worldwide temperature measurements that have been available since around 1850 and the analyzes of various climate archives . Compared with the fluctuations of the seasons and with the change from day to night, the numbers given below appear small; as a global change in climate, however, they mean a lot when you consider the average temperature on earth during the last ice age , which was only around 6 K lower .
In 2005 u. a. Based on the measured temperature increase of the oceans over a decade, it is calculated that the earth consumes 0.85 watts per square meter more power than it radiates into space.
Previous temperature increase


According to a publication published in 2016, the global average temperature began to rise as early as 1830 due to human activity. This was found in a broad study in which a large number of palaeoclimatological indicators of bygone times (so-called climate proxies ) were evaluated worldwide . At that time there was no dense network of temperature measuring stations. A clear warming phase could be observed between 1910 and 1945, in which natural fluctuations also had a clear influence due to the still comparatively low concentration of greenhouse gases. The warming is most pronounced from 1975 until today.
2016 was the warmest year since measurements began in 1880. It was around 1.1 ° C warmer than in pre-industrial times. 2017 was the warmest non-El Niño year to date and also the second warmest year since measurements began. Every decade since the 1980s has been warmer than the previous one; the five warmest years in descending order were 2016, 2019, 2015, 2017 and 2018. According to figures from the Copernicus program , the warming was even 1.3 ° C above the level of the pre-industrial period, bringing the politically targeted limit of 1.5 ° C was almost reached at times. Compared to 2015, the additional warming was 0.2 ° C.
Between 1880 and 2012, the globally averaged, ground-level air temperatures increased by 0.85 ° C. Particularly in the case of short time series, it must be taken into account that the beginning and end of the year can have a strong influence on the trend and therefore do not necessarily have to reflect long-term trends. An example of such a deviation is the period between 1998 and 2012, the one with a strong El Niñoand with it the extraordinarily hot year began, which is why the warming trend of 0.05 ° C per decade in this period remained well below the long-term trend of 0.12 ° C per decade in the period 1951 to 2012. Nevertheless, the 30 years from 1983 to 2012 in the northern hemisphere were the warmest normal period in 1400 years. In this context, a study published in 2020 based on a detailed analysis of paleo-climatic data comes to the conclusion that the warming that has occurred in the 21st century to date has a high probability of exceeding the temperature values of the Holocene optimum climate (about 8,000 to 6,000 years ago).
In a study published in 2007, the natural share of the warming in the 20th century was limited to below 0.2 K.
Ocean warming

In addition to the air, the oceans have also warmed up, absorbing over 90% of the additional thermal energy. While the world's oceans only heated up by 0.04 K from 1955 to the mid-2000s due to their enormous volume and great temperature inertia, their surface temperature increased by 0.6 K in the same period At a depth of 75 meters, the temperature rose by an average of 0.11 K per decade from 1971 to 2010.
The energy content of the world's oceans increased by approx. 14.5 × 10 22 joules between the mid-1950s and 1998 , which corresponds to a heating output of 0.2 watts per m² of the entire earth's surface. The energy increase in the world's oceans of 14.5 × 10 22 joules corresponds to the energy of 100 million Hiroshima atomic bombs ; this amount of energy would heat the bottom 10 kilometers of the atmosphere by 22 K. Over the period 1971 and 2016, the averaged heat absorption of the oceans was around 200 terawatts and thus more than 10 times as high as the entire world energy consumption of mankind.
The heat content of the oceans has been measured with the help of the Argo program since 2000, which means that considerably more precise data on the condition and changes in climatologically relevant measured values (e.g. heat content, salinity , depth profile) have been available since that time . The past ten years have been the warmest years for the oceans since measurements began; 2019 the warmest so far.
Spatial and temporal distribution of the observed warming

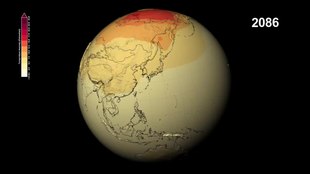
Air over land surfaces generally heats up more than over water surfaces, which can be seen in the animation at the beginning of this article (third position at the top right). The warming of the land areas between 1970 and 2014 averaged 0.26 K and thus more than twice as high as over the sea, which warmed by 0.12 K in the same period. Because of this different rapid warming of land and sea, many regions on land have already warmed up by more than 1.5 degrees Celsius. At the same time, the temperatures in the northern hemisphere, on which the majority of the land area is located, rose more sharply in the past 100 years than in the southern hemisphere, as the graphic opposite shows.
The night and winter temperatures rose slightly more than the day and summer temperatures. Broken down according to the seasons, the greatest warming was measured during the winter months, and particularly strong over western North America, Scandinavia and Siberia. In spring, temperatures rose most in Europe and in North and East Asia. Europe and North Africa were hardest hit in summer, and northern North America, Greenland and East Asia saw the largest increase in autumn. The warming was particularly striking in the Arctic , where it is about twice as high as the global average. With the exception of a few regions, global warming has been detectable since 1979.
Theoretically, different levels of warming are expected for the various layers of air in the earth's atmosphere and, in fact, measured. While the earth's surface and the low to medium troposphere should warm up, models for the higher stratosphere suggest a cooling. In fact, exactly this pattern was found in measurements. The satellite data shows a decrease in the lower stratosphere temperature of 0.314 K per decade over the past 30 years. This cooling is caused on the one hand by the increased greenhouse effect and on the other hand by ozone depletion by CFCs in the stratosphere, see also the Montreal Protocol on the Protection of the Ozone Layer. If the sun were the main cause, the layers close to the surface, the lower to middle troposphere and the stratosphere would have had to warm up. According to current understanding, this means that the majority of the observed warming must be caused by human activities.
The ten warmest years since 1880

The ten warmest years in the period from 1880 to 2019 - Deviation from the long-term average temperature (1901-2000) in ° C
|
|
Temporary cooling or pause in global warming
Even assuming a warming of 4 K by the end of the 21st century, there will always be phases of stagnation or even cooling. These phases can last up to approx. 15 years. Causes are the eleven-year sunspot cycle , cooling strong volcanic eruptions and the natural property of the global climate to show a fluctuating temperature profile ( AMO , PDO , ENSO ). For example, the occurrence of El Niño or La Niña events can raise or lower the global average temperature by 0.2 K from one year to the next and cover the annual warming trend of approx. 0.02 K for a few years , but also reinforce.
Feedback
The global climate system is characterized by feedbacks that increase or decrease temperature changes. Feedback that reinforces the cause is called positive feedback . According to the current state of knowledge, the positive feedbacks are significantly stronger than the negative feedbacks in certain states of global climate events, so that the climate system can tip over into another state.
The two strongest, positive feedback processes are the ice-albedo feedback and the water vapor feedback. A melting of the polar ice caps causes an additional energy input via the ice-albedo feedback due to reduced reflection. The water vapor feedback occurs because the atmosphere of a warmer world also contains more water vapor. Since water vapor is by far the most powerful greenhouse gas, a warming process that has been initiated is further intensified - regardless of what ultimately triggered this warming. The same applies to cooling, which is further intensified by the same processes. For the quantitative description of the reaction of the climate to changes in the radiation balance , the term ofEstablished climate sensitivity . It can be used to compare different influencing variables with one another.
Another positive feedback is provided by the CO 2 itself. With increasing global warming, the water in the oceans also becomes warmer and can therefore absorb less CO 2 . As a result, more CO 2 can get into the atmosphere, which can further intensify the greenhouse effect. At the moment, however, the oceans still absorb around 2 Gt of carbon (this corresponds to around 7.3 Gt of CO 2 ) more than they release into the atmosphere in the same period of time, see acidification of the seas .
In addition to these three physically well-understood feedback factors, there are other feedback factors, the effects of which are much more difficult to assess, especially with regard to clouds, vegetation and the ground.
Importance of clouds for the climate

Clouds have a significant impact on the earth's climate by reflecting part of the incident radiation. Radiation from the sun is reflected back into space, and radiation from the layers of the atmosphere below is reflected towards the ground. The brightness of the clouds comes from short-wave radiation in the visible wavelength range.
A greater optical thickness of low clouds means that more energy is reflected back into space; the temperature of the earth is falling. Conversely, less dense clouds allow more solar radiation to pass through, which warms the layers of the atmosphere below. Low clouds are often dense and reflect a lot of sunlight back into space. They are also lower in the atmosphere, where temperatures are higher, and therefore give off more heat. The tendency of low clouds is therefore to cool the earth.
High clouds are usually thin and not very reflective. Although they allow a large part of the solar heat to pass through, they reduce the amount of sunlight irradiated somewhat, so that the photosynthetic performance of green plants is also impaired by high cirrus veils or many contrails , but at night the heat radiation from the earth's surface and thus the nightly cooling is somewhat reduced. Because they are very high where the air temperature is very low, these clouds do not give off much heat. The tendency of high clouds is to warm the earth a little at night.
The vegetation and the nature of the soil and in particular its sealing , deforestation or agricultural use have a significant influence on evaporation and thus on cloud formation and the climate. A reduction in cloud formation by plants has also been proven: these emit up to 15 percent less water vapor with an increase in CO 2 ; this in turn reduces cloud formation.
Overall, cloud feedback is likely to exacerbate global warming. A simulation published in 2019 suggests that at a CO 2 concentration above 1,200 ppm stratocumulus clouds could break up into scattered clouds, which would further fuel global warming.
Influence of vegetation and soil

Vegetation and soil reflect the incident sunlight differently depending on their nature. Reflected sunlight is thrown back into space as short-wave solar radiation (otherwise the surface of the earth would be black from the perspective of space without an infrared camera). The albedo is a measure of the retroreflective power of diffusely reflective (re-emitting), i.e. non-reflective and non-luminous surfaces.
| surfaces | Albedo in% |
|---|---|
| Settlements | 15 to 20 |
| Tropical rain forest | 10 to 12 |
| Deciduous forest | 12 to 15 |
| Cultural areas | 15 to 30 |
| Grassland | 12 to 30 |
| Arable land | 15 to 30 |
| Sandy soil | 15 to 40 |
| Dune sand | 30 to 60 |
| Glacial ice | 30 to 75 |
| asphalt | 15th |
| Clouds | 60 to 90 |
| water | 5 to 22 |
Not only the consumption of fossil fuels leads to the release of greenhouse gases. Intensive cultivation of arable land and deforestation are also significant sources of greenhouse gas. For the process of photosynthesis, the vegetation needs CO 2 to grow. Soil is an important sink because it contains organic, carbonaceous matter. This stored carbon is more easily released in the form of CO 2 through agricultural activities such as plowing , because more oxygen can enter the soil and the organic material is broken down more quickly. Methane release from wetlands is likely to decrease with increasing temperatureto; There is still uncertainty about the level of the release (as of 2013).
In the permafrost of western Siberia store 70 billion tons of methane in oceans have on the continental slopes much larger quantities in the form of methane hydrate deposited. Due to local climate changes (currently: +3 K within 40 years in Western Siberia), regionally critical temperatures could be reached even with low global warming; there is a risk of the methane stored there being released into the atmosphere.
A calculation assuming such feedback was made by scientists at the University of California, Berkeley , who assumed that the CO 2 content of the atmosphere will increase from the current approximately 390 ppmV to approximately 550 ppmV by 2100. This is solely the anthropogenic increase brought about by mankind. The increased temperature leads to additional release of greenhouse gases, especially CO 2 and methane. As the temperature rises, there is an increased release of CO 2 from the world's oceans and the accelerated rotting of biomass, which releases additional methane and CO 2 . Through this feedbackglobal warming could be 2 K stronger than assumed in 2006. For this and other reasons, Barrie Pittock estimates in Eos, the American Geophysical Union publication , that future warming could exceed the ranges stated by the IPCC. He gives eight reasons for his assumption, including the decline in global darkening and feedback effects from biomass.
Projected warming

If the CO 2 concentration in the atmosphere doubles , climatologists assume that the increase in the earth's mean temperature will be within 1.5 to 4.5 K. This value is also known as climate sensitivity and is related to the pre-industrial level (from 1750), as is the radiative forcing that is decisive for it; With this size all known factors influencing the radiation balance of the earth are quantitatively described by the IPCC and made comparable. According to the 5th Assessment Report, the IPCC expects the global average temperature to increase by 1.0 to 3.7 K by the year 2100 (based on 1986-2005 and depending on the GHG emission path and the climate model used). For comparison: the fastest warming in the course of the last ice age to the present warm period was a warming of about one degree per 1000 years.
According to a study at the Carnegie Institution for Science , in which the results of a carbon cycle model were evaluated with data from comparative studies between climate models of the fifth IPCC assessment report, the global climate system reacts to a CO 2 input with a time delay of about 10 years with a step function; this means that the warming reaches its maximum after about 10 years and then remains there for very long periods of time.
The Climate Action Tracker indicates the most likely global warming to be expected by the end of this century. Accordingly, the world is currently (2016) on the way to a warming of 3.6 ° C compared to the pre-industrial global average temperature. To calculate this value, the voluntary commitments of the most important emitters to reduce greenhouse gas emissions are fed into a climate model.
Long-term consideration and the resulting consequences
According to a study published in 2009, the warming that has already started will be irreversible for at least 1000 years, even if all greenhouse gas emissions were to be completely stopped today. In other scenarios, the emissions continued gradually until the end of our century and then also ended abruptly. In doing so, essential assumptions and statements made in the 4th IPCC report over the next 1000 years were confirmed and refined. Long-term climate simulations indicate that the earth, heated by an increased carbon dioxide concentration, will only cool down by about one degree per 12,000 years.
A complete burning of the fossil energy resources , which are conservatively estimated at 5 trillion tons of carbon , would, however, lead to a global temperature increase of about 6.4 to 9.5 ° C, which has very strong negative effects on ecosystems , human health , agriculture, the economy etc. would have. If both conventional and unconventional resources were burned, the carbon dioxide concentration in the earth's atmosphere could rise to around 5000 ppm by the year 2400. In addition to an enormous increase in temperature, the Antarctic ice sheet would almost completely melt, which means that the sea level would also be without taking the Greenland ice sheet into account would increase by about 58 m.
Projections 2050
In 2019, the Crowther Lab at ETH Zurich forecast the temperatures in 520 metropolises worldwide for the year 2050. For 22% of the cities, climatic conditions are forecast that are currently not found in any city in the world. The others are forecasted with conditions that currently correspond to another city. Vienna, for example, should have a climate similar to Skopje , Hamburg like San Marino , Berlin and Paris like Canberra in Australia, London like Melbourne , Athens and Madrid like Fez in Morocco, Nairobi should have a climate similar to Maputo . New York should have a climate like Virginia Beach, Virginia Beach like Podgorica , Seattle like San Francisco, Toronto like Washington DC, Washington DC like Nashville .
State of research
History of science

In 1824, Jean Baptiste Joseph Fourier discovered the greenhouse effect. Eunice Newton Foote was the first to experimentally investigate the effect of solar radiation on hermetically sealed glass tubes filled with various gases. She demonstrated the absorption of thermal radiation by carbon dioxide and water vapor , recognized this as a possible cause of climate change events and published her results in 1856. This became known only in 2010 ; John Tyndallsucceeded in 1859 in concrete proof of the absorption of long-wave infrared radiation emanating from the earth's surface by greenhouse gases; he determined the relative importance of water vapor compared to carbon dioxide and methane for the natural greenhouse effect. Following up on Tyndall, Svante Arrhenius published the hypothesis in 1896 that anthropogenic CO 2 accumulation in the atmosphere could increase the temperature of the earth. It was then that the “science of global warming” in the narrower sense began.
In 1908, the British meteorologist and later President of the Royal Meteorological Society Ernest Gold (1881-1976) published an essay on the stratosphere . In it he wrote that the temperature of the tropopause rises with increasing CO 2 concentration. This is a hallmark of global warming that could also be measured almost a century later.
It was first demonstrated in the late 1950s that the carbon dioxide content of the atmosphere was rising: on the initiative of Roger Revelle , Charles David Keeling started regular measurements of the CO 2 content of the atmosphere ( Keeling curve ) on Mount Mauna Loa ( Hawaii , Big Island) in 1958 ). Gilbert Plass first used computers in 1956 and much more accurate absorption spectra of CO 2 to calculate the expected warming. He received 3.6 K (3.6 ° C) as a value for the climate sensitivity .
The first computer programs for modeling the world's climate were written in the late 1960s.
In 1979 the National Academy of Sciences wrote in the " Charney Report" that an increase in carbon dioxide concentration was undoubtedly linked to significant global warming; However, due to the inertia of the climate system, significant effects are only to be expected in a few decades.
US climate scientist James Hansen said on June 23, 1988 before the Energy and Natural Resources Committee of the US Senate , he was 99 percent sure that the respective annual record temperature was not the result of natural fluctuations. This is considered to be the first such statement by a scientist before a political body. As early as this meeting, calls were made for political measures to slow global warming. In November 1988 the Intergovernmental Panel on Climate Change ( IPCC), which is supposed to work with political decision-makers and governments: Here, the scientific state of knowledge on global warming and the anthropogenic part of it is discussed, coordinated and summarized in reports.
Anthropogenic global warming in the context of geological history
Research into the causes and consequences of global warming has been closely linked to the analysis of climatic conditions of the past since its inception. Svante Arrhenius, who was the first to point out that humans warm the earth through the emission of CO 2 , recognized the climatic influence of changing concentrations of carbon dioxide in the earth's atmosphere while searching for the causes of the ice ages.
Like earthquakes and volcanic eruptions, climate change is also natural. Earth's climate has changed constantly since the earth was formed, and it will continue to change in the future. Primarily responsible for this were a changing concentration and composition of greenhouse gases in the atmosphere due to the different intensity of volcanism and erosion. Other factors affecting the climate are variable solar radiation, among other things due to the Milanković cycles , as well as plate tectonicscaused permanent reshaping and shifting of the continents with a resulting shift of large ocean currents. Land masses at the poles encouraged the formation of ice caps, and altered oceanic currents directed heat either away from or towards the poles, thus affecting the strength of the very powerful ice-albedo feedback .
Although the luminosity and radiant power of the sun at the beginning of the earth's history were about 30 percent below today's values, conditions prevailed throughout that time under which liquid water could exist. This phenomenon, known as the weak young sun paradox , led to the hypothesis of a “CO 2 thermostat” in the 1980s : It kept the temperatures of the earth constant for billions of years in areas that made life on our planet possible. When volcanoes emitted more CO 2 , causing temperatures to rise, the degree of weathering increased, creating more CO 2was bound. If the earth was cold and the concentration of greenhouse gas was low, weathering was greatly reduced by the icing of large areas of land. The greenhouse gas that continued to flow into the atmosphere as a result of volcanism accumulated there up to a certain tipping point, eventually triggering a global thaw. The disadvantage of this mechanism is that it takes several millennia to correct for greenhouse gas levels and temperatures, and there are several known cases where it failed.

It is believed that the great oxygen catastrophe 2.3 billion years ago caused a collapse in methane concentrations in the atmosphere. This reduced the greenhouse effect so much that it resulted in extensive and long-lasting glaciation of the earth during the Huronian Ice Age . In the course of - probably several - Snowball Earth events during the Neoproterozoic around 750 to 635 million years ago, the earth's surface froze again almost completely.
The last such event occurred just before the Cambrian explosion 640 million years ago and is called the Marino Ice Age . The bright surface of the almost completely frozen earth reflected almost all of the incident solar energy back into space and thus kept the earth trapped in the ice age state; This only changed when the concentration of carbon dioxide in the earth's atmosphere rose to extremely high levels due to the volcanism that continued beneath the ice. Since the CO 2-Thermostat reacts sluggishly to changes, the earth not only thawed, but also plunged into the other extreme of a super greenhouse for several decades. The extent of the icing is, however, controversial in science because climate data from this time are imprecise and incomplete. According to recent studies, a similar constellation occurred at the Carbon-Permian transition about 300 million years ago when the atmospheric carbon dioxide concentration decreased to a minimum of probably 100 ppm. As a result, the earth's climate system moved into the immediate vicinity of the tipping point that would have brought the planet into the climatic state of global icing.
In contrast, at the time of what was probably the greatest mass extinction 252 million years ago , the earth was a super greenhouse with much higher temperatures than today. This drastic increase in temperature, which wiped out almost all life on earth at the Permian Triassic border , was very likely caused by a long-lasting intense volcanic activity that led to the formation of the Siberian Trapps . Current isotope studies indicate that the seas of that time warmed by up to 8 K within a relatively short period of time and, at the same time, became strongly acidic. During these and other periods of extremely high temperatures, the oceans were largely devoid of oxygen. SuchOceanic anoxic events were repeated several times in the history of the earth. We now know that phases of strong cooling, such as during the Grande Coupure , as well as rapid warming were accompanied by mass extinctions . The paleontologist Peter Ward even claims that all known mass extinctions in Earth's history, with the exception of the KT impact , were triggered by climate crises.

The climate of the past 10,000 years has been unusually stable compared to the frequent and strong fluctuations of the previous millennia. This stability is a basic requirement for the development and continued existence of human civilization . Most recently, rapid and strong global warming occurred during the Paleocene / Eocene temperature maximum and at Eocene Thermal Maximum 2 , which was caused by a massive input of carbon (CO 2 and / or methane) into the atmosphere. These epochs are therefore the subject of intensive research in order to gain knowledge about the possible effects of ongoing man-made warming.
The current climate change expected for the coming years may have the magnitude of major climatic changes in the history of the earth, but the predicted coming temperature change is at least 20 times faster than in all global climate changes of the last 65 million years. Looking at the rate of heating phases of ice ages to interglacial periods , such as five times occurred in the last 500,000 years, so it was there in each case to periods of rapid warming. These phases lasted about 10,000 years each and were characterized by an increase of about 4 to 5 ° C. With the current man-made warming, the increase has been without significant climate protection measures, also calculated with approx. 4 to 5 ° C - only that this process takes place in 100 instead of 10,000 years.
Based on the almost two hundred years of extensive data and research, it can be assumed that the Pliocene epoch can be an analogous example for the near future of our planet. The carbon dioxide content of the atmosphere in the middle Pliocene was determined with the help of the isotope investigation of Δ13C and was then in the range of 400 ppm, which corresponds to the concentration in 2015. With the help of climate proxies , the temperature and sea level of the time 5 million years ago can be reconstructed. At the beginning of the Pliocene, the global mean temperature was 2 K higher than in the Holocene; Due to the enormous heat capacity of the world's oceans, the global annual average temperature reacts very slowly to changes in radiative forcing, and so it has only risen by about 1 K since the beginning of the industrial revolution.
The warming leads, among other things, to a rise in sea level . In the middle of the Pliocene, the sea level was around 20 meters higher than it is today.
Intergovernmental Panel on Climate Change (IPCC)
The Intergovernmental Panel on Climate Change (IPCC) was set up in 1988 by the United Nations Environment Program (UNEP) together with the World Meteorological Organization (WMO) and is associated with the Framework Convention on Climate Change , which was concluded in 1992 . For its reports, which appear every six years, the IPCC summarizes the worldwide research results in the field of climate change and thus reflects the current state of knowledge in climatology.
The organization was awarded the Nobel Peace Prize in 2007, together with former US Vice President Al Gore . The fifth assessment report was published in September 2013.
How sure are the findings on global warming?

Since the discovery of the greenhouse effect in the atmosphere by Jean Baptiste Joseph Fourier in 1824 and the description of the greenhouse effect of water vapor and carbon dioxide by John Tyndall in 1862, scientific research into the Earth's climate system has become more and more precise. There is now "overwhelming evidence" that global warming is real, man-made and a major threat.
The warming effect of greenhouse gases has been known for 150 years and the increase in concentration in the earth's atmosphere could then be reliably demonstrated in the mid-1950s. The pronounced and uninterrupted global warming that has been observed since the mid-1970s cannot be attributed primarily to solar influences or other natural factors with the help of the measurement technology that has been significantly improved since then, as these have only changed minimally since then. Fundamental research on the effects of greenhouse gases was carried out by oceanographer Veerabhadran Ramanathan in the mid-1970s.
Hundreds of thousands of climatological studies have since been published, the vast majority (around 97%) of which support the scientific consensus on climate change. Projections and calculations that were made decades ago were still quite wide, but overall they hit the trend surprisingly well. If the models are fed with more up-to-date measurements, especially the radiation balance between the upper atmosphere and space, then the scatter between the models decreases and the mean value for warming at the end of the century increases somewhat.
Trends and exact times
In climate research, one differentiates between trend and point in time and calculates the probability of occurrence. In the context of global warming, for example, the following is not exactly known: Several event times, including the time when the Arctic will be ice-free in summer in the 21st century; The exact sea level rise by the end of the 21st century is also unknown. Uncertainties exist in the exact type, shape, location and distribution of global tipping points in the climate system and, associated with this, in the knowledge of the precise regional effects of global warming. The majority of the relevant scientific principles, however, are considered to be very well understood.
The scientific consensus on climate change

The topic of global warming was initially the subject of controversial discussions with changing focuses. At the beginning of the 20th century, the uncertainty prevailed as to whether the theoretically predicted warming would be measurable at all. When a significant rise in temperature was first registered in some regions of the USA during the 1930s, this was regarded as a strong indicator of increasing global warming, but at the same time it was doubted whether this process was actually based on human influences. These doubts are expressed by some allegedly climate-skeptical groups to this day, and occasionally the media even predict a global cooling for the coming decades, which is rejected by climate researchers.
Today there is a consensus among experts on man-made global warming that has existed since the early 1990s at the latest. Other sources date the establishment of the scientific consensus as early as the 1980s. So held z. For example, the interim report published in 1988 by the Enquete Commission on Precautions to Protect the Earth's Atmosphere found that a consensus on the existence and human causes of climate change had already been reached at the 1985 Villach climate conference :
“In Villach (Austria, 1985) scientists from all over the world agreed for the first time that the global average temperature near the ground would increase. There was also consensus that the human-caused increase in the concentrations of climate-relevant greenhouse gases in the atmosphere, especially that of carbon dioxide (CO 2 ), methane (CH 4 ), tropospheric ozone, nitrous oxide (N 2 O) and chlorofluorocarbons (CFCs), leads to an increase in temperature. "
The scientific consensus expressed in the IPCC reports is expressly shared by the national and international science academies and all G8 countries.
The scientific consensus on climate change is that the Earth's climate system is warming and will continue to warm. This is determined on the basis of observations of the increasing average temperature of the air and oceans, large-scale melting of snow and ice surfaces and the rise in sea level . With at least 95 percent certainty, this is mainly caused by greenhouse gases (burning of fossil fuels, methane emissions from livestock farming, release of CO 2 during cement production) and the clearing of forest areas. The American Association for the Advancement of Science- the world's largest scientific society - shows that 97% of all climatologists agree that man-made climate change is happening, and highlights the consensus that exists on many aspects of climatology. Since the turn of the millennium at the latest, the level of knowledge about the consequences of climate change has been viewed as sufficiently reliable to justify extensive climate protection measures.
According to a study published in 2014, assuming no anthropogenic greenhouse effect, there was only a 0.001% probability of the event actually occurring for at least 304 months in a row (from March 1985 to the status of the analysis in June 2010) with a monthly mean of global temperature above the mean for the 20th century.
Denial of man-made global warming

Although there has been a strong scientific consensus on man-made global warming for decades, parts of the public and a large number of political and economic actors continue to reject the existence of climate change, its human cause, the associated negative consequences or the scientific consensus about it . The denial of man-made climate change is a form of pseudoscience that has similarities with other forms of scientific denial such as denying the theory of evolution or the harmful effects of smoking to believing inConspiracy theories . In part, there are personal, organizational and economic connections between these forms of denial of scientific knowledge. A central connection pattern is, among other things, the constant fabrication of artificial controversies such as the supposed controversy about global warming , which, contrary to popular belief, is not a scientific discussion, but rather the conscious dissemination of false claims by climate deniers. The denial of climate research is considered to be "by far the most coordinated and financed form of science denial" and at the same time represents the backbone of the anti- environmental movementand their opposition to environmental research .
The rejection of the scientific consensus is particularly pronounced in states in which an influential counter-movement was created with great financial commitment by companies, especially from the fossil energy sector , whose aim is to ensure the existence of the scientific consensus by consciously sowing doubts to undermine. These actions were particularly successful among conservative sections of the population in the USA. Conservative think tanks play an important role in obscuring the state of the art .
The most important forces of the organized climate denial movement , which deny the existence of man-made global warming through targeted attacks on climate research, include the Cato Institute , the Competitive Enterprise Institute , the George C. Marshall Institute and the Heartland Institute , all of which are conservative think tanks. Its aim was and is to use the Fear, Uncertainty and Doubt strategy to create uncertainty and doubts about the existence of global warming in the population, and then to argue that there is not enough evidence to support concrete climate protection measuresto take. In total, the US climate contrarian movement has around $ 900 million a year for campaign purposes. The overwhelming majority of funding comes from politically conservative organizations, with funding increasingly being disguised through donors trust organizations . The majority of the literature that contradicts man-made climate change has been published without peer review , is usually of a pseudoscientific nature (i.e. appears outwardly scientific, but without meeting scientific quality standards), was largely funded by organizations and companies that benefit from the use of fossil fuels benefit, and is associated with conservative think tanks.
Consequences of global warming
Global warming is fraught with risks because of its effects on human safety , health , the economy and the environment . These risks become greater with increasing warming and are higher at 2 degrees warming than if global warming is limited to 1.5 degrees. The negative effects of global warming are already occurring today and may have a. already affected many ecosystems on land and in water. Some changes that are already noticeable today, such as reduced snow cover, rising sea levels or melting glaciersIn addition to temperature measurements, they are also considered evidence of climate change. Consequences of global warming have a direct impact on both humans and ecosystems . In addition, climate change exacerbates many other serious problems such as B. species loss or soil degradation , so that combating climate change is also a key measure for solving other urgent problems on the way to a sustainable way of life.
Scientists project various direct and indirect effects on the hydrosphere, atmosphere, and biosphere. In the report of the Intergovernmental Panel on Climate Change ( IPCC ) these projections are assigned probabilities. The consequences include heat waves, especially in the tropics, a rise in sea level that affects hundreds of millions of people, and crop failures that threaten global food security . According to a World Bank report, a world that is warming up strongly is associated with considerable adverse effects for people.
Unexpected changes and "tipping points"

A distinction is made between at least two types of unexpected effects: combined effects, in which several extreme events act together and mutually reinforce their effects (e.g. droughts and large fires), and tipping elements . Due to the multiple feedbacks in the earth system, this often reacts to influences non-linearly, which means that changes in these cases do not take place continuously, but erratically. There are a number of tipping elements which, as the temperature progresses, will likely adopt a new state abruptly, which at a certain point ( tipping point ) will be difficult or impossible to reverse. Examples of tipping elements are the melting of the Arctic ice sheet or a slowing down of thethermohaline circulation .
Other examples of abrupt events are the sudden extinction of a species that - possibly pre-stressed by other environmental factors - is eliminated by an extreme climatic event, or the effect of rising sea levels. These do not lead directly to flooding, but only if in the context of z. B. storm surges a previously sufficient dam is flooded. The rise in sea level itself can also accelerate rapidly in a very short time due to non-linear effects, as was the case in climatic history, for example, with meltwater pulse 1A .
Studies of climatic changes in the history of the earth show that climate change in the past was not only gradual and slow, but sometimes very quickly. This was the case at the end of the Younger Dryas and during the Dansgaard-Oeschger events in the last glacial periodregional warming of 8 ° C can be observed in about 10 years. Based on what we know today, it seems likely that these rapid jumps in the climate system will also take place in the future when certain tipping points are exceeded. Since the possibility of depicting the climate in climate models will never fully correspond to reality, the climate system cannot be predicted in detail due to its chaotic nature and the world is increasingly moving outside the range for which reliable past climate data are available, neither can The type, extent and timing of such events can be predicted.
However, Will Steffen and others calculated the probable temperature ranges of global warming in 2018, in which critical thresholds for tipping elements can be reached, so that “they are put into fundamentally different states.” Feedback could trigger further tipping elements, whose change only for higher temperature ranges is to be expected. The thermohaline circulation is influenced by a strong melting of the Greenland ice , which is possible even with a global warming between 1 and 3 degrees . Its collapse is in turn linked to the El Niño-Southern Oscillation , the partial withering of the Amazon rainforest and the melting of the Antarctic Sea-, later mainland ice . Even if the climate target of 2 degrees global warming is met , there is a risk of a domino effect , a cascade that would lead the climate uncontrollably and irreversibly into a warm climate , with temperatures around 4 to 5 degrees higher in the long term and a sea level rise of 10 to 60 meters.
Effects on the biosphere
The risks to ecosystems on a warming earth grow with each degree of temperature rise. The risks below a warming of 1 K compared to the pre-industrial value are comparatively low. Between 1 and 2 K warming, there are sometimes substantial risks at the regional level. A warming above 2 K carries increased risks for the extinction of numerous animal and plant species whose habitats no longer meet their requirements. For example, the IPCC assumes that the world's coral reefswill decrease by 70-90% if the temperature increases by 1.5 degrees. If the temperature rises by 2 degrees, the IPCC anticipates a decline of more than 99% and thus an almost complete disappearance of the coral reefs. If the temperature rises by more than 2 K, there is a risk of collapse of ecosystems and significant effects on water and food supplies due to crop failure.
- Plant growth has increased in recent decades due to increased amounts of precipitation, temperature and CO 2 content in the atmosphere. Between 1982 and 1999 it rose by six percent on a global average, particularly in the tropics and the temperate zone of the northern hemisphere .
- Risks to human health are in part a direct consequence of rising air temperatures . Heat waves will become more common, while extreme cold events will likely become less frequent. While the number of heat deaths is likely to increase, the number of cold deaths will decrease.
- Despite global warming, cold events can occur locally and temporarily. Climate simulations predict, for example, that the melting of the Arctic ice can lead to severe disruptions in air currents. This could triple the likelihood of extremely cold winters in Europe and North Asia.
- Agricultural productivity will be affected by both a rise in temperature and a change in rainfall. Global is, roughly speaking, with a deterioration in potential outputto be expected. The extent of this negative trend is, however, fraught with uncertainty, as it is unclear whether a fertilization effect occurs due to increased carbon concentrations (−3%) or not (−16%). According to model calculations, however, tropical regions will be more severely affected than temperate regions, in which, with carbon fertilization, even significant increases in productivity are expected in some cases. For example, India is expected to drop by around 30–40% by 2080, while estimates for the United States and China are between −7% and +6%, depending on the carbon fertilization scenario. Added to this are likely changes in the distribution areas and populations of pests. Also according to model calculations, there will be around 529 per year with unchecked climate change.Fruit and vegetable consumption , expected. With a strict climate protection program (implementation of the RCP 2.6 scenario), however, the number of additional deaths could be limited to around 154,000.
- There will be changes in human and animal health risks as a result of changes in the range, population, and infection potential of disease vectors .
Effects on the hydrosphere and atmosphere

- Rising air temperatures are changing the distribution and extent of precipitation worldwide. According to the Clausius-Clapeyron equation , the atmosphere can absorb approx. 7% more water vapor with every degree of temperature increase , which in turn acts as a greenhouse gas . As a result, the average amount of precipitation will increase globally, but the drought will also increase in individual regions, on the one hand due to the decrease in the amount of precipitation there , but also due to the accelerated evaporation at higher temperatures .
- The increasing evaporation leads to a higher risk of heavy rain , floods and floods .
- Glacier melt is increasing worldwide .
- In the course of global warming, sea levels rise . This increased by 1–2 cm per decade in the 20th century and is accelerating; at the beginning of the 21st century the rate was 3–4 cm. By the year 2100 the IPCC expects a further sea level rise of probably 0.29–0.59 m with strict climate protection and 0.61–1.10 m with further increasing greenhouse gas emissions, a sea level rise of up to 2 m cannot be ruled out. In the long term, it is assumed that the sea level will rise by around 2.3 m per additional degree Celsius of warming.
- According to the World Meteorological Organization, there are so far indications for and against the presence of an anthropogenic signal in the previous records of tropical cyclones , but so far no firm conclusions can be drawn. The frequency of tropical storms is likely to decrease, but their intensity will increase.
- There are indications that global warming via a change in Rossby waves (large-scale oscillations of air currents) leads to an increased occurrence of weather extremes (e.g. heat waves , floods).
Peace and world order, politics
In its Global Risks 2013 report, the World Economic Forum Davos classifies climate change as one of the most important global risks: The interplay between the stress on economic and ecological systems will present unpredictable challenges for global and national resilience.
Various military strategists and security experts fear geopolitical upheavals as a result of climate change, which harbors security policy risks for the stability of the world order and " world peace ". The UN Security Council also issued a corresponding declaration in 2011 on Germany's initiative. The former German Foreign Minister Frank-Walter Steinmeier also rated climate change as “a growing challenge for peace and stability” in April 2015 after the publication of a European study for the “ G7 ” Foreign Ministers' Meeting in Lübeck . The study recommends u. a. the establishment of a G7 task force .
Social science aspects
economy
According to current estimates, the economic consequences of global warming are considerable: In 2004/5, the German Institute for Economic Research estimated that if climate protection is not implemented quickly, climate change could result in economic costs of up to 200,000 billion US dollars by 2050 (although this estimate is accompanied by large Is fraught with uncertainties). The Stern Report (commissioned by the then British government in mid-2005) estimated the damage to be expected from climate change by the year 2100 at 5 to 20 percent of global economic output.
According to a Lancet report published in advance of the 23rd UN Climate Change Conference (“ COP 23 ”) taking place in Bonn in November 2017 , the number of weather-related natural disasters has increased by 46% since 2000; In 2016 alone, this caused economic damage of $ 126 billion.
See also “ Climate Finance ”, Climate Insurance , Loss and Damage , Corporate Climate Risks
Limit global warming
In order to stabilize the earth's temperature and limit the consequences of global warming, global greenhouse gas emissions must be limited to net zero , as only a certain global CO 2 budget is available for each temperature target . Conversely, this means that global warming continues as long as greenhouse gases are emitted and the total amount of greenhouse gases in the atmosphere increases. Simply reducing emissions does not stop global warming, it only slows it down.
Climate policy
Greenhouse gases accumulate evenly in the atmosphere, their effect does not depend on where they are emitted. A reduction in greenhouse gas emissions thus benefits everyone; but it is often associated with efforts and costs for those who reduce their greenhouse gas emissions. The reduction of global emissions to net zero thus faces the so-called free rider problem : Actors who are predominantly self-interested want a stabilization of the climate and the corresponding climate protection efforts of others, but do not see sufficient incentives for their own climate protection efforts. International climate policy is faced with the task of creating a global regulatory framework that promotes collective action towards climate neutrality causes.
history

As the heart of international climate policy that applies Framework Convention on Climate Change (UNFCCC) of the United Nations as the international law binding regulation to climate protection. It was adopted in New York City in 1992 and in the same year at the UN Conference on Environment and Development ( UNCED ) in Rio de Janeirosigned by most states. Its main goal is to avoid dangerous disruption of the climate system as a result of human activity. The framework convention is a newly emerged principle of the community of states that a reaction to such a massive threat to the global environment should be made without precise knowledge of the ultimate actual extent. Agenda 21 was also adopted at the Rio conference and has since been the basis for many local protective measures.
The 197 contracting parties of the Framework Convention (as of March 2020) meet annually for UN climate conferences . The most famous of these conferences were in 1997 in Kyoto , Japan , which resulted in the Kyoto Protocol , in Copenhagen in 2009 and in Paris in 2015 . All contracting states agreed there to limit global warming to well below 2 ° C compared to pre-industrial times. The aim is to limit the temperature to 1.5 ° C.
The two-degree goal

As a limit from a tolerable to a “dangerous” disruption of the climate system, an average warming of 2 ° C compared to the pre-industrial level is commonly assumed in climate policy. The fear that beyond 2 ° C the risk of irreversible, abrupt climate changes increases significantly. In Germany, the German Advisory Council on Global Change (WBGU) recommended in 1994 that mean warming be limited to a maximum of 2 ° C. The Council of the European Union adopted the target in 1996. The G8 recognized it at the G8 summit in July 2009. In the same year it found its way into the UN framework as part of the Copenhagen Accord and became part of international lawBinding form adopted in 2015, the Paris Agreement entered into force in November 2016.
However, the requirement is noticeably moving into the distance: Since a warming of 1.1 ° C has already occurred (as of 2019), only 0.9 ° C remains. In scenarios that are still considered feasible, greenhouse gas emissions would have to reach their maximum as early as 2020 and then decrease rapidly to achieve the target. According to a report by the United Nations Environment Program released in November 2019, there are no signs that emissions will peak in the next few years. Should the signatory states to the Paris Agreement reduce their emissions as promised by 2016 (→ National climate protection contribution), this results in a global warming of 2.6 to 3.1 ° C by 2100 and a further increase in temperature after 2100. In order to comply with the two-degree limit, a subsequent tightening of the commitments or an overachievement of the targets are absolutely necessary.
The rise in sea level would not have stopped with the two-degree limit. The sometimes significantly stronger warming over the land areas brings further problems. Temperatures are expected to rise particularly sharply over the Arctic . For example, indigenous peoples declared the two-degree target to be too weak because it would still destroy their culture and way of life, be it in arctic regions, in small island states as well as in forest or dry areas.
Economic debate
In the social science literature, various political instruments for reducing greenhouse gas emissions are recommended and Sometimes discussed controversially. In economic analyzes, there is broad consensus that pricing CO 2 emissions that internalizes the damage caused by climate change as much as possible is a central instrument for effective and cost-efficient climate protection. Such CO 2 prize , by controlling, emissions trading of both instruments can be realized, or combinations. Some scientists such as B. Joachim Weimannrecommend global emissions trading as the most efficient instrument on its own. Other economists such as For example, the British energy scientist Dieter Helm, on the other hand, consider a CO 2 tax more suitable because it is more stable than the fluctuating CO 2 prices in emissions trading, which are too difficult for companies to calculate. Others (e.g. the American political economist Scott Barrett) argue that state-prescribed technical standards (certain low- CO 2 or CO 2 -free production technologies or consumer goods such as cars) as in the Montreal Protocolto protect the ozone layer could be politically enforced far better in international politics than a global emissions trading scheme or a CO 2 tax. The social scientist Anthony Patt also considers emissions trading to be too ineffective in real politics, since the political resistance against sufficient (i.e. sufficient for decarbonization ) strongly rising or high CO 2 prices, especially on the part of energy-intensive industries, is too great. The CO 2 prices would therefore - as with EU emissions trading- only fluctuate at a low level, so that (with sole emissions trading), capital-intensive, long-term future investments in CO 2 -free technologies would not be worthwhile for potential eco-investors . Instead, they would need the certain expectation that CO 2 prices will rise and remain high in the future, so that they can foreseeably assert themselves on the competitive market against competitors who operate with CO 2 -intensive technologies. However, the political system cannot reliably commit itself to a future reliably rising, high CO 2 price, since such political decisions are or would always be reversible in a democracy (for example, in Australia a CO 22 tax was only introduced and abolished by a new, conservative government after two years). This is also known as the “commitment problem” of climate policy.
Therefore, Anthony Patt advocates laws to subsidize CO 2 -free technologies such as For example, the Renewable Energy Sources Act (EEG) in Germany, which creates precisely this security of expectations for potential investors in CO 2 -free technologies: The EEG guarantees (at least until the 2016 EEG amendment) a producer of electricity Renewable energies for a long period of time (20 years) a certain sales price which is above the market level. This guarantee is subject to the constitutional protection of legitimate expectations. Secured in this way, investors in renewable energies succeeded in the last two decades by increasing the costs of generating electricity from renewable energiesTo reduce learning by doing ( experience curve ) very much and to gradually become competitive with electricity from fossil energy sources and nuclear power . Similar arguments, which emphasize the need to flank emissions trading through laws such as the EEG, can be found in the 2011 special report by the Council of Economic Experts for Environmental Issues or by the energy economist Erik Gawel. Proponents of emissions trading counter this by saying that the state would intervene too strongly in the market and, in contrast to it, would select excessively expensive technologies for subsidization, since, unlike the market players, it did not have the knowledge about the most efficient technologies. As a result, economic resources would be wasted, so that society could afford less climate protection than actually possible (i.e. with ideal emissions trading).
Climate protection

Political requirements for climate protection must be implemented through appropriate measures. On the technical side, there are a number of options for reducing greenhouse gas emissions that can be used to implement the energy transition. A study published in 2004 came to the conclusion that effective climate protection could already be achieved with the resources available at the time. The German Academy of Natural Scientists Leopoldina stated in a statement published in 2019 that, from a technical point of view, all requirements for the construction of a climate-neutral energy system are in place. In addition to the technologies, the concepts required for the energy transition are also known.
While in the past the costs for climate protection technology such. If, for example, renewable energies were significantly higher than for conventional technology, climate protection costs have now fallen significantly due to the rapid drop in prices. The IPCC put the cost of achieving the two-degree target in 2014 at 0.06% of the annual consumption growth rate. The earlier the greenhouse gas emissions are reduced, the lower the costs of climate protection.
The majority of recent studies assume that a renewable energy system can deliver energy at comparable costs to a conventional energy system. At the same time, climate protection would have strong positive economic side effects by avoiding consequential damage to the climate and avoiding air pollution from fossil fuels. The phase-out of coal is regarded as an important individual measure for achieving the two-degree target , as this allows the tight remaining budget of carbon dioxide emissions to be used as efficiently as possible. With more than 10 billion tonnes of CO 2 emissions in 2018, coal-fired power plants cause around 30% of the total energy-related carbon dioxide emissions of around 33 billion tonnes.
In its special report 1.5 ° C global warming , the IPCC lists the following criteria in order to still be able to achieve the 1.5 degree target:
- Net zero carbon dioxide emissions by 2050 at the latest
- strong reductions in other greenhouse gases, especially methane
- Realization of energy savings
- Decarbonisation of the electricity sector and other fuels
- Electrification of final energy consumption (a form of sector coupling )
- strong reduction in greenhouse gas emissions from agriculture
- Use of some form of Carbon Dioxide Removal
Technical and individual options
Renewable energy

The conversion of the energy system from fossil to renewable energy sources, the so-called energy turnaround , is seen as another indispensable part of an effective climate protection policy. The global potential is presented in the IPCC report. In contrast to fossil fuels, when using renewable energies, with the exception of bioenergy, no carbon dioxide is emitted, and this too is largely CO 2 -neutral . The use of renewable energies offers great potential both ecologically and economically, above all by largely avoiding the consequential damage associated with other forms of energy, which are known as external costs cause high economic welfare losses.
Basically, it can be said that renewable energies have a better environmental balance compared to conventional forms of energy use. Although the material requirements for these technologies are higher than for the construction of thermal power plants, the environmental impact due to the higher material requirements is low compared to the fuel-related direct emissions from fossil-fired power plants . By converting the energy supply to a regenerative energy system, the environmental pollution caused by the energy sector can be reduced. The vast majority of studies carried out on the topic come to the conclusion that the complete conversion of the energy supply to renewable energies is both technically possible and economically feasible.
Improve energy efficiency

Improving energy efficiency is a key element in achieving ambitious climate protection goals and at the same time keeping energy costs low. If energy efficiency increases, a service or a product can be offered or produced with less energy consumption than before. This means, for example, that an apartment needs less heating, a refrigerator requires less electricity or a car consumes less fuel. In all of these cases, the increasing efficiency leads to a decrease in energy consumption and thus to reduced greenhouse gas emissions. McKinsey also calculated that numerous energy efficiency measures simultaneously generate economic benefits.
In a global balance, however, the rebound effect must also be taken into account, which leads to increased energy and resource efficiency being partially offset by increased production of products or services. It is assumed that the energy savings through energy efficiency measures due to the rebound effect are reduced by an average of 10%, with values from individual studies fluctuating between 0 and 30%.
Carbon Dioxide Removal
Carbon Dioxide Removal is understood to mean the removal of carbon dioxide from the atmosphere in order to artificially reduce the increased radiative forcing. Carbon dioxide removal can be achieved through the use of technologies for CO2 removal ("negative emissions"). These include:
- Bioenergy with CO2 capture and storage , BECCS (capture of carbon dioxide from biomass and subsequent storage in the soil)
- Direct air capture capture and storage, DACCS (separation of carbon dioxide from the air and subsequent storage in the ground)
- artificial weathering to bind carbon dioxide in rock
- Afforestation and reforestation of forests to bind carbon dioxide in biomass
- Timber construction
- Artificially increasing the carbon dioxide content of the oceans in plant biomass or by increasing the alkalinity
- Increase in the carbon content in the soil through changes in land management
- Production of biochar for carbon storage in the soil
The majority of the models come to the conclusion that negative emissions are necessary to limit global warming to 1.5 or 2 degrees. At the same time, according to a review published in 2016, it is considered very risky to strive for the use of negative emission technologies from the outset, as there are currently no such technologies with which the two-degree target without significant negative effects on the consumption of space , energy , water or Nutrients or on the albedo can be achieved. Because of these limitations, they are no substitute for the immediate and rapid reduction of today's greenhouse gas emissions through the decarbonization of the economy.
Geoengineering
Geoengineering encompasses previously unused technical interventions in the environment in order to mitigate the warming, including iron fertilization in the sea to stimulate algae growth and in this way bind CO 2 , and the introduction of sulfate aerosol into the stratosphere to reflect the sun's rays. Both measures are now considered unusable.
Increase in resource productivity
Energy can also be saved by increasing resource productivity (see also factor 4 ), extending product lifetimes and reducing obsolescence , for example in the case of consumer goods or packaging.
Climate protection through behavioral changes
Personal contributions

Individual possibilities for contributions to climate protection exist in behavioral changes and changed consumption with energy savings . Among the many measures for CO 2 reduction include:
- the use of environmentally friendly means of transport, especially public transport (see also comparison of means of transport ),
- the use of more energy-efficient devices (see also energy label ),
- the optimal setting and, if necessary, retrofitting of heaters and heat engines (motors);
- the reduction of heating energy (e.g. by installing new windows , thermal insulation of external walls, intermittent ventilation instead of continuous ventilation),
- the use of heat pump heating , solar thermal energy , geothermal energy and wood instead of fossil fuels for heating buildings and hot water supply ,
- the installation of a photovoltaic system ,
- the purchase or use of the mini-cogeneration in the form of a combined heat and power unit (a motor generates electricity, the waste heat is used for heating).
A particularly high reduction in greenhouse gases can be achieved by avoiding meat consumption, modern heating and insulation and flying less once a year. The general population is often mistaken about what helps a lot and what does little to combat climate change. For example, 22% of Germans see doing without plastic bags as the change in behavior that can do the most to combat climate change. In fact, the potential contribution is negligibly small and by avoiding meat consumption you can achieve 260 times more, by halving 130 times more.
Sustainable nutrition

According to estimates by the IPCC (2007), 10 to 12 percent of global greenhouse gas emissions are due to agriculture . However, the consequences of the deforestation of large areas (including rainforest) for agricultural purposes were not taken into account here. A study commissioned by Greenpeace therefore assumes an agricultural share of 17 to 32 percent of man-made greenhouse gases. In the UK, around 19 percent of greenhouse gas emissions are related to food (agriculture, processing, transportation, retail, consumption, waste). According to these estimates, around 50 percent of this goes to meat and dairy productsback. The Food Climate Research Network therefore recommends, among other things, market-oriented and regulatory measures for more sustainable production and more sustainable consumption of food (e.g. CO 2 emission-dependent prices / taxes). According to a study, switching to plant-based diets in four types of country can offset between 9 and 16 years of past CO 2 emissions from fossil fuels.
If global meat consumption were to be reduced to less than a third within 40 years from 2015, according to a model simulation, nitrous oxide and methane emissions from agriculture would fall below the 1995 level.
The consumption of regional foods is often recommended to reduce food-related emissions . In 2019, the Potsdam Institute for Climate Impact Research showed in a study that optimized local production could reduce emissions from food transport worldwide by a factor of ten. A US life cycle assessmentAccording to von Weber and Matthews (2008), the contribution of transport to the emissions of the food supply in the USA is only 11 percent. The main part (83 percent) arises during production, which is why the type of food consumed has the greatest influence. The consumption of red meat is viewed particularly critically with regard to the production of greenhouse gases; Instead, poultry, fish, eggs or vegetables should be used.
Economic strategies
In addition to setting the course for an energy turnaround and phasing out coal , the repertoire of climate protection measures also includes B. the withdrawal of investors such as insurance companies , credit institutions and banks from investments in fossil-fueled industrial sectors and companies ("disinvestment"). Instead, investments can be diverted to sustainable economic sectors such as renewable energies . So has z. B. the World Bank at the One Planet SummitIt was announced in Paris at the beginning of December 2017 that it would no longer finance projects for the development of oil and natural gas from 2019 . The insurance company Axa announced there that it would no longer insure new coal-fired power plants in the future and that it would invest twelve billion euros in “green” projects by 2020 . Environmental protection organizations like Urgewald focus their activities here.
Adaptation strategies
In parallel to preventive climate protection in the form of avoidance strategies, adjustments to the effects of man-made climate change that have already occurred or are expected in the future are necessary: The negative consequences associated with global warming should be reduced as far as possible and made as compatible as possible; at the same time, the use of regionally possibly positive consequences is examined. The adaptability varies depending on various parameters, including existing knowledge of local climate changes or e.g. B. the level of development and the economic performance of a country or society. Overall, especially in socio-economic terms, the ability to adapt is strongly influenced by vulnerability . TheThe Intergovernmental Panel on Climate Change (IPCC) counts the least advanced “ developing countries ” among the countries and regions with particularly high vulnerability.
Adaptation to the consequences of global warming has mainly short to medium-term effects. However, since the adaptability of societies is limited and strong global warming can undo any adaptation measures that have already been taken, adaptation cannot be an alternative to preventive climate protection, but only an addition to it.
The range of potential adaptation measures extends from purely technological measures (e.g. coastal protection ) to changes in behavior (e.g. eating habits, choice of holiday destinations) and business decisions (e.g. changed land management) to political decisions (e.g. planning regulations , Emission reduction targets). Given that climate change affects many sectors of an economy , integrating adaptation e.g. B. in national development plans, poverty reduction strategies or sectoral planning processes a central challenge; many states have therefore developed adaptation strategies.
In the Framework Convention on Climate Change ( UNFCCC ) passed in 1992 , which has meanwhile been ratified by 192 countries, the subject of adaptation hardly played a role in the prevention of dangerous climate change (Article 2 of the UNFCCC). The same applies to the Kyoto Protocol , which was agreed in 1997 and came into force in 2005, but the decision was made to set up a special UN Adaptation Fund in order to provide financing for the developing countries particularly affected to support adaptation measures. The United Nations Green Climate Fund , which will be held during theClimate Conference 2010 in Cancun. Industrialized nations provide money for the fund so that developing countries can better adapt to climate change.
At the latest with the 3rd assessment report of the IPCC, which was published in 2001, the understanding of the need for adaptation strategies has increased. In terms of scientific support for governments, the 2006 Nairobi work program on adaptation and vulnerability was an important step.
Global warming as an issue in education, film, literature and the arts
Global warming is increasingly an issue in art , literature, and film ; The topic is presented, for example, in the disaster films Waterworld or The Day After Tomorrow .
There are also a number of documentaries : An inconvenient truth is one of the core messages of Nobel Prize winner Al Gore on anthropogenic climate change. The Swedish documentary Our Planet also deals with climate change and includes interviews with various climate researchers. The US documentary Chasing Ice has the glacier shrinkage as a result of global warming on the content and portrays the Extreme Ice Survey project of the nature photographer James Balog .
In literary terms the topic is u. a. processed in the novels by the British writer Ian McEwan ( Solar ) or the team of authors Ann-Monika Pleitgen and Ilja Bohnet (No Getting Through) published in 2010 . In analogy to “ science fiction ”, the development of a new literary genre is now being spoken of, climate fiction (CliFi) .
In 2013, under the aegis of the German Advisory Council on Global Change, the comic The Great Transformation was published. Climate - can we get the curve? (→ World in Transition - Social Contract for a Great Transformation ) .
Cape Farewell is an international charitable project by British artist David Buckland. The aim is the collaboration of artists, scientists and "communicators" (including media representatives) on the subject of climate change. As part of the project, various expeditions to the Arctic and the Andes were carried out. a. were processed cinematically, photographically, literarily and musically (e.g. in the films Art from the Arctic and Burning Ice ).
Italy's Minister of Education, Lorenzo Fioramonti , announced in November 2019 that the topic of global warming would be integrated into various subjects in public schools in Italy as a compulsory subject from September 2020. While the 6- to 11-year-olds are to be made familiar with the subject of the environment through stories from other cultures , this will be done in the intermediate level through technical information. In the upper level, the students should be introduced to the UN program " Transformation of our world: the 2030 Agenda for Sustainable Development ". The aim is one school lesson (45 minutes each) per week.
literature
- 2006, Tim Flannery: We Weather Makers. How people are changing the climate and what that means for our life on earth. S. Fischer, Frankfurt am Main, ISBN 3-10-021109-X .
- Kirstin Dow, Thomas E. Downing: World Atlas of Climate Change - Maps and Facts on Global Warming. European Publishing House , ISBN 978-3-434-50610-2 .
- 2008, Mark Maslin: Global Warming: A Very Short Introduction. Oxford University Press, ISBN 978-0-19-954824-8 .
- 2009, John Houghton: Global Warming: The Complete Briefing. 4th edition. Cambridge University Press, ISBN 978-0-521-70916-3 .
- Mojib Latif : Climate Change and Climate Dynamics. Ulmer, Stuttgart, ISBN 978-3-8252-3178-1 .
- Andreas Lienkamp : Climate Change and Justice . An ethic of sustainability from a Christian perspective. Schöningh, Paderborn, ISBN 978-3-506-76675-5 .
- 2010, Marco Müller, Giovanni Danielli: Compact Knowledge on Climate Change. Swiss measures and instruments. Verlag Rüegger , Zurich, ISBN 978-3-7253-0925-2 .
- October, City of Stuttgart , Department of Urban Development and Environment, Office for Environmental Protection, Department of Urban Climatology, in conjunction with the Department of Communication (Ed.): Series of publications by the Office for Environmental Protection - Issue 3/2010 : Climate Change - Challenge for Urban Climatology , ISSN 1438- 3918 .
- 2012, Mojib Latif : Global Warming. UTB, Stuttgart, ISBN 978-3-8252-3586-4 .
- November Four-degree dossier for the World Bank: Risks of a future without climate protection. In: Potsdam Institute for Climate Impact Research. November 19, 2012, accessed on January 20, 2013 (complete version of the report “Turn down the heat”, available online, PDF, 14.38 MB ).
- 2013, Friedrich-Wilhelm Gerstengarbe and Harald Welzer (eds.): Two degrees more for Germany. 1st edition, S. Fischer, ISBN 978-3-596-18910-6 .
- 2014, Intergovernmental Panel on Climate Change (IPCC): Climate Change 2013/14. (AR 5) Synthesis report , WG I, Physical Basis , WG II, Consequences, Adaptation and Vulnerability , WG III, Coping with Climate Change .
- 2015, Jochem Marotzke , Martin Stratmann (ed.): The future of the climate. New insights, new challenges. A report from the Max Planck Society. Beck, Munich, ISBN 978-3-406-66968-2 .
- 2018, Intergovernmental Panel on Climate Change (IPCC): Special report 1.5 ° C global warming , website of the report (English).
- Stefan Rahmstorf , Hans Joachim Schellnhuber : Climate change . 8th edition. Beck, Munich, ISBN 978-3-406-72672-9 .
- 2019, United In Science - High-level synthesis report of latest climate science information convened by the Science Advisory Group of the UN Climate Action Summit 2019, World Meteorological Organization .
- 2019, Jörg Phil Friedrich : What comes after climate change? A speculation Heise Medien, Hannover 2019, ISBN 978-3-95788-179-3 .
See also
- Anthropocene
- Global environmental changes and future scenarios
- List of the largest greenhouse gas emitters
- List of countries by temperature
- Oceanic anoxic event
- Social science research on climate change
Web links
- Website (English) of the IPCC , as well as its German coordination office with translations of the reports
- Climate Service Center - Information portal of the Helmholtz Center Geesthacht on climate research
- Klimawiki of the Hamburg education server
- Climate change dossier from the Federal Agency for Civic Education
- Climate change information portal of the Central Institute for Meteorology and Geodynamics in Austria
- Climate Change: Evidence & Causes (English) from the Royal Society and National Academy of Sciences
- Climate and energy of the German Federal Environment Agency
- Global Warming - understanding the forecast (video, English) - David Archer explains in his lectures all aspects essential for understanding the topic
- Climate Change, Lines of Evidence (video) - information series from the Board Of Atmospheric Sciences And Climate of the National Research Council and the National Academy Of Sciences
Remarks
- ↑ In the article (e.g. depending on the source) temperature differences are given in ° C ( degrees Celsius ), K ( Kelvin ) or degrees . These details are equivalent, i.e. H. if at an initial temperature of 20 ° C a temperature increase of 1 ° C / 1 K / 1 degree occurs, the temperature is then 21 ° C.
Individual evidence
- ↑ NASA : GISS Surface Temperature Analysis (GISTEMP v3) .
- ^ Myles Allen et al .: Summary for Policymakers. In: Global Warming of 1.5 ° C . IPCC special report. 2018.
- ↑ a b Climate breaks multiple records in 2016, with global impacts. In: Press release No. 04/2017. World Meteorological Organization , March 21, 2017, accessed May 23, 2019 .
- ↑ WMO climate statement: past 4 years warmest on record . World Meteorological Organization . Retrieved April 21, 2019.
- ↑ a b WMO confirms 2019 as second hottest year on record . World Meteorological Organization . Retrieved January 15, 2020.
- ^ Lineare Trends Climate Change 2007: Working Group I: The Physical Science Basis, Executive Summary. IPCC, 2007, accessed September 16, 2015 .
- ↑ IPCC 2018: Chap. 1: Framing and Context, p. 59 . Special report 1.5 ° C global warming . Retrieved April 20, 2019.
- ^ A b Noah Diffenbaugh, Christopher Field : Changes in Ecologically Critical Terrestrial Climate Conditions . In: Science . 341, No. 6145, August 2013, pp. 486-492. doi : 10.1126 / science.1237123 . , Summary online
- ^ Richard E. Zeebe, Andy Ridgwell, James C. Zachos : Anthropogenic carbon release rate unprecedented during the past 66 million years . (PDF) In: Nature Geoscience . 9, No. 4, April 2016, pp. 325–329. doi : 10.1038 / ngeo2681 .
- ↑ Frequently Asked Question 6.2: Is the Current Climate Change Unusual Compared to Earlier Changes in Earth's History? Climate Change 2007: Working Group I: The Physical Science Basis. IPCC, 2007, archived from the original on May 16, 2016 ; accessed on May 20, 2016 .
- ↑ Hartmut Graßl : Climate Change. The most important answers . Freiburg im Breisgau 2007, p. 63f; See also Haydn Washington, John Cook : Climate Change Denial. Heads in the sand . Earthscan 2011, p. 34.
- ^ State of the Climate in 2015 . In: J. Blunden, DS Arndt (Ed.): Special Supplement to the Bulletin of the American Meteorological Society . tape 97 , no. 8 , 2016, p. S1-S275 .
- ↑ IPCC, 2014: Climate Change 2014: Synthesis Report. Contribution of Working Groups I, II and III to the Fifth Assessment Report of the Intergovernmental Panel on Climate Change [Core Writing Team, RK Pachauri and LA Meyer (eds.)]. IPCC, Geneva, Switzerland, page 5.
- ↑ a b Wuebbles, DJ, DW Fahey, KA Hibbard, DJ Dokken, BC Stewart, and TK Maycock: USGCRP, 2017: Climate Science Special Report: Fourth National Climate Assessment, Volume I, p. 126. In: https: // science2017.globalchange.gov/ . USA, 2017, Retrieved May 4, 2019 .
- ↑ a b S. A. Marcott, JD Shakun, PU Clark, AC Mix: A Reconstruction of Regional and Global Temperature for the Past 11,300 Years . In: Science . 339, No. 6124, March 7, 2013, p. 1198. doi : 10.1126 / science.1228026 .
- ↑ Naomi Oreskes , Erik M. Conway : Merchants of Doubt. How a handful of Scientists obscured the truth on issues from tobacco smoke to Global Warming . Bloomsbury Press, New York 2010, p. 170 .
- ↑ quoted from Nathaniel Rich : Losing Earth , p. 189 (in the German translation p. 214).
- ↑ see also the EXXON -internal letter dated November 12, 1982 (PDF, 13 MB)
- ↑ a b James Lawrence Powell: The Inquisition of Climate Science . New York 2012, p. 178.
- ^ A b Cook et al .: Quantifying the consensus on anthropogenic global warming in the scientific literature . In: Environmental Research Letters . tape 8 , 2013, doi : 10.1088 / 1748-9326 / 8/2/024024 .
- ↑ a b c Joeri Rogelj et al .: Paris Agreement climate proposals need a boost to keep warming well below 2 ° C . In: Nature . tape 534 , 2016, p. 631–639 , doi : 10.1038 / nature18307 .
- ^ A b Will Steffen et al .: Trajectories of the Earth System in the Anthropocene . In: Proceedings of the National Academy of Sciences . tape 115 , no. 33 , 2018, p. 8252-8259 , doi : 10.1073 / pnas.1810141115 .
- ^ R. Philipona, B. Dürr, C. Marty, A. Ohmura, M. Wild (2004): Radiative forcing - measured at Earth's surface - corroborate the increasing greenhouse effect. In: Geophysical Research Letters, Vol. 31, February 6, online
- ^ JE Harries, HE Brindley, PJ Sagoo, RJ Bantges (2001): Increases in greenhouse forcing inferred from the outgoing longwave radiation spectra of the Earth in 1970 and 1997. Nature, Vol. 410, pp. 355-357, March 15 , online
- ↑ a b D.R. Feldman et al .: Observational determination of surface radiative forcing by CO2 from 2000 to 2010 . In: Nature . tape 519 , 2015, p. 339–343 , doi : 10.1038 / nature14240 .
- ↑ World Meteorological Organization : Greenhouse gas concentrations in atmosphere reach yet another high. November 25, 2019, accessed November 25, 2019 .
- ↑ a b Joint statement of the national science academies of the G8 countries as well as Brazil, India and China. Published by The Royal Society 2005: Joint science academies' statement: Global response to climate change. Ref 08/05 Online
- ^ Naomi Oreskes (2004): The Scientific Consensus on Climate Change. In: Science Vol. 306 of December 4 (corrected: January 21, 2005) ( PDF; 81 kB )
- ↑ Meehl, Gerald A., Warren M. Washington, Caspar M. Ammann, Julie M. Arblaster, TML Wigleiy and Claudia Tebaldi (2004): Combinations of Natural and Anthropogenic Forcings in Twentieth-Century Climate. In: Journal of Climate , Vol. 17, October 1, pp. 3721–3727 ( PDF; 368 kB )
- ↑ Hansen, James et al. a. (2007): Dangerous human-made interference with climate: a GISS modelE study. In: Atmospheric Chemistry and Physics, Vol. 7, pp. 2287–2312 ( PDF; 6 MB ( Memento from October 22, 2011 in the Internet Archive ))
- ^ Gabriele C. Hegerl , Thomas R. Karl, Myles Allen a. a .: Climate Change Detection and Attribution: Beyond Mean Temperature Signals. In: Journal of Climate , Vol. 19, Special Section, October 15, 2006, pp. 5058–5077, doi: 10.1175 / JCLI3900.1 ( online )
- ↑ a b c d e Intergovernmental Panel on Climate Change (2007): IPCC Fourth Assessment Report - Working Group I Report on "The Physical Science Basis" with a summary for decision-makers in German ( Memento from August 1, 2012 in the Internet Archive ) (PDF; 2.7 MB)
- ↑ The greenhouse effect and greenhouse gases. In: Windows to the universe
- ↑ Data.GISS: GISTEMP - The Elusive Absolute Surface Air Temperature. Retrieved on February 15, 2017 (English, From the NASA FAQ: The "natural value" is determined using models. The results vary between 56 ° F and 58 ° F, a value of approximately 14 ° C is most likely.).
- ↑ US Department of Commerce, NOAA, Earth System Research Laboratory: ESRL Global Monitoring Division - Global Greenhouse Gas Reference Network. Retrieved February 15, 2017 (American English).
- ↑ Walther Roedel, Thomas Wagner: Physics of our environment: The atmosphere . 4th edition, Springer, Berlin 2011, ISBN 978-3-642-15728-8 , p. 44. Online, pdf ( Memento from March 4, 2016 in the Internet Archive )
- ↑ Myhre, G., D. Shindell, F.-M. Bréon, W. Collins, J. Fuglestvedt, J. Huang, D. Koch, J.-F. Lamarque, D. Lee, B. Mendoza, T. Nakajima, A. Robock, G. Stephens, T. Takemura and H. Zhang, 2013: Anthropogenic and Natural Radiative Forcing . In: Climate Change 2013: The Physical Science Basis. Contribution of Working Group I to the Fifth Assessment Report of the Intergovernmental Panel on Climate Change [Stocker, TF, D. Qin, G.-K. Plattner, M. Tignor, SK Allen, J. Boschung, A. Nauels, Y. Xia, V. Bex and PM Midgley (eds.)]. Cambridge University Press, Cambridge, United Kingdom and New York, NY, USA.
- ↑ AR5, cit. to: Mojib Latif : Are we getting the climate out of sync? In: Klaus Wiegandt (Ed.): Courage for Sustainability. 12 ways into the future . Frankfurt am Main 2016, 80-112, pp. 101-104.
- ↑ JA Mäder, J. Staehelin, T. Peter, D. Brunner, HE Rieder, WA Stahel: Evidence for the effectiveness of the Montreal Protocol to protect the ozone layer . In: Atmospheric Chemistry and Physics Discussions . 10, No. 8, 2010, p. 19005. doi : 10.5194 / acpd-10-19005-2010 .
- ↑ a b c d e Federal Environment Agency: Key messages of the Fifth Assessment Report of the IPCC. Climate Change 2013: Scientific Basics (Partial Report 1) ( Memento from September 23, 2015 in the Internet Archive ). Last accessed on November 15, 2016.
- ^ The Keeling Curve Daily Reading
- ^ Yi Ge Zhang, Mark Pagani, Zhonghui Liu, Steven M. Bohaty, Robert DeConto: A 40-million-year history of atmospheric CO 2 . (PDF) In: The Royal Society (Philosophical Transactions A) . 371, No. 2001, September 2013. doi : 10.1098 / rsta.2013.0096 .
- ↑ Aradhna K. Tripati, Christopher D. Roberts & Robert A. Eagle: Coupling of CO2 and Ice Sheet Stability Over Major Climate Transitions of the Last 20 Million Years. In: Science . Vol. 326, No. 5958, December 4, 2009, pp. 1394-1397, doi: 10.1126 / science.1178296
- ↑ Urs Siegenthaler, Thomas F. Stocker , Eric Monnin, Dieter Lüthi, Jakob Schwander, Bernhard Stauffer, Dominique Raynaud, Jean-Marc Barnola, Hubertus Fischer, Valérie Masson-Delmotte & Jean Jouzel: Stable Carbon Cycle – Climate Relationship During the Late Pleistocene . In: Science . Vol. 310, No. 5752, pp. 1313-1317, November 25, 2005, doi: 10.1126 / science.1120130
- ↑ Dieter Lüthi, Martine Le Floch, Bernhard Bereiter, Thomas Blunier, Jean-Marc Barnola, Urs Siegenthaler, Dominique Raynaud, Jean Jouzel, Hubertus Fischer, Kenji Kawamura & Thomas F. Stocker: High-resolution carbon dioxide concentration record 650,000–800,000 years before present . In: Nature . Vol. 453, pp. 379-382, 2008, doi: 10.1038 / nature06949
- ↑ Corinne Le Quéré et al .: Temporary reduction in daily global CO2 emissions during the COVID-19 forced confinement . In: Nature Climate Change . tape 10 , 2020, p. 647-653 , doi : 10.1038 / s41558-020-0797-x .
- ↑ Laetitia Loulergue, Adrian Schilt, Renato Spahni, Valérie Masson-Delmotte, Thomas Blunier, Bénédicte Lemieux, Jean-Marc Barnola, Dominique Raynaud, Thomas F. Stocker & Jérôme Chappellaz: Orbital and millennial-scale features of atmospheric CH4 over the past 800,000 years . In: Nature . Vol. 453, 2008, pp. 383-386, doi: 10.1038 / nature06950
- ↑ Maurice E. Pitesky, Kimberly R. Stackhouse & Frank M. Mitlöhner: Clearing the Air: Livestock's Contribution to Climate Change. In Donald Sparks (ed.): Advances in Agronomy. Vol. 103. Academic Press, Burlington 2009, pp. 1-40.
- ^ Robin McKie: Sharp rise in methane levels threatens world climate targets . In: The Observer . February 17, 2019, ISSN 0029-7712 ( theguardian.com [accessed July 14, 2019]).
- ↑ a b c Piers Forster, Venkatachalam Ramaswamy et al .: Changes in Atmospheric Constituents and in Radiative Forcing. In: Climate Change 2007: The Physical Science Basis. Contribution of Working Group I to the Fourth Assessment Report of the Intergovernmental Panel on Climate Change. Cambridge University Press, Cambridge / New York 2007, p. 212 ( PDF )
- ^ Drew T. Shindell , Greg Faluvegi, Dorothy M. Koch, Gavin A. Schmidt , Nadine Unger & Susanne E. Bauer: Improved attribution of climate forcing to emissions. In: Science . Vol. 326, No. 5953, 2009, pp. 716-718, doi: 10.1126 / science.1174760
- ^ Mason Inman: Carbon is forever. In: Nature Reports Climate Change. November 20, 2008, doi: 10.1038 / climate.2008.122
- ↑ TJ Blasing: Recent Greenhouse Gas Concentrations. In: Carbon Dioxide Information Analysis Center (CDIAC). Last updated on February 20, 2013, doi: 10.3334 / CDIAC / atg.032
- ↑ a b c Stefan Rahmstorf & Hans Joachim Schellnhuber : Climate change. Diagnosis, prognosis, therapy. 7th edition. Beck, Munich 2012, ISBN 978-3-406-63385-0
- ↑ BH Samset, M. Sand, CJ Smith, SE Bauer, PM Forster: Climate Impacts From a Removal of Anthropogenic Aerosol Emissions . In: Geophysical Research Letters . tape 45 , no. 2 , January 8, 2018, ISSN 1944-8007 , p. 1020-1029 , doi : 10.1002 / 2017GL076079 .
- ↑ Yangyang Xu, Veerabhadran Ramanathan, David G. Victor: Global warming will happen faster than we think . In: Nature . tape 564 , no. 7734 , December 5, 2018, p. 30-32 , doi : 10.1038 / d41586-018-07586-5 ( nature.com ).
- ↑ Spencer Weart: The Discovery of Global Warming: General Circulation Models of Climate. Center of History at the American Institute of Physics - online
- ↑ Robert Kaufman et al .: Reconciling anthropogenic climate change with observed temperature 1998–2008 . In: Proceedings of the National Academy of Sciences . tape 108 , no. 29 , 2011, p. 11790–11793 , doi : 10.1073 / pnas.1102467108 ( pnas.org ).
- ↑ Usoskin, IG & Kovaltsov, GA (2008): Cosmic rays and climate of the Earth: Possible connection. CR Geoscience 340: 441 to 450. doi: 10.1016 / j.crte.2007.11.001 .
- ^ Laut, Peter (2003): Solar activity and terrestrial climate: an analysis of some purported correlations. In: Journal of Atmospheric and Solar-Terrestrial Physics, Vol. 65, pp. 801 to 812, doi: 10.1016 / S1364-6826 (03) 00041-5 (PDF; 263 kB)
- ^ Evan, Amato T., Andrew K. Heidinger and Daniel J. Vimont: Arguments against a physical long-term trend in global ISCCP cloud amounts. In: Geophysical Research Letters, Vol. 34, 2007, L04701, doi: 10.1029 / 2006GL028083
- ^ J Imbrie, JZ Imbrie: Modeling the Climatic Response to Orbital Variations . In: Science . 207, No. 4434, 1980, pp. 943-953. bibcode : 1980Sci ... 207..943I . doi : 10.1126 / science.207.4434.943 . PMID 17830447 .
- ^ Berger A, Loutre MF: Climate: An exceptionally long interglacial ahead? . In: Science . 297, No. 5585, 2002, pp. 1287-8. doi : 10.1126 / science.1076120 . PMID 12193773 .
- ↑ Hartmut Graßl : Climate Change. The most important answers . Freiburg im Breisgau 2007, p. 40
- ^ Climate Change 2001: Working Group I: The Scientific Basis. (PDF) In: Intergovernmental Panel on Climate Change Working Group I. 2001, accessed on May 18, 2012 (Chapter 6.4 Stratospheric Ozone).
- ↑ IPCC / TEAP Special Report on Safeguarding the Ozone Layer and the Global Climate System: Issues Related to Hydrofluorocarbons and Perfluorocarbons (summary for policy makers) Archived from the original on February 21, 2007. (PDF) In: Intergovernmental Panel on Climate Change and Technology and Economic Assessment Panel . 2005.
- ^ Judith Lean (2010): Cycles and trends in solar irradiance and climate. In: Wiley Interdisciplinary Reviews: Climate Change, Volume 1, Issue 1, pp. 111 to 122, doi: 10.1002 / wcc.18
- ↑ a b c d G. Myhre, D. Shindell et al. a .: Anthropogenic and Natural Radiative Forcing . In: TF Stocker u. a. (Ed.): Climate Change 2013: The Physical Science Basis. Contribution of Working Group I to the Fifth Assessment Report of the Intergovernmental Panel on Climate Change . 2013, p. 661, 688-691 ( ipcc.ch [PDF; 19.4 MB ]).
- ^ Antonello Pasini, Umberto Triacca, Alessandro Attanasio: Evidence of recent causal decoupling between solar radiation and global temperature . In Environmental Research Letters Vol. 7, No. 3 July - September 2012, doi: 10.1088 / 1748-9326 / 7/3/034020 PDF
- ^ IPCC, 2013: Summary for Policymakers . In: TF Stocker u. a. (Ed.): Climate Change 2013: The Physical Science Basis. Contribution of Working Group I to the Fifth Assessment Report of the Intergovernmental Panel on Climate Change . 2013, p. 14 .
- ↑ a b Urs Neu: Claim: "Cosmic radiation causes climate change". November 3, 2015, accessed August 15, 2019 .
- ^ Henrik Svensmark, Eigil Friis-Christensen: Variation of cosmic ray flux and global cloud coverage — a missing link in solar-climate relationships . In: Journal of Atmospheric and Solar-Terrestrial Physics . tape 59 , 1997, doi : 10.1016 / S1364-6826 (97) 00001-1 .
- ↑ EM Dunne et al .: Global atmospheric particle formation from CERN CLOUD measurements . In: Science . tape 354 , 2016, doi : 10.1126 / science.aaf2649 .
- ^ JR Pierce, PJ Adams: Can cosmic rays affect cloud condensation nuclei by altering new particle formation rates? In: Geophysical Research Letters . tape 36 , 2009, doi : 10.1029 / 2009GL037946 .
- ↑ V.-M. Kerminen et al .: Atmospheric data over a solar cycle: no connection between galactic cosmic rays and new particle formation . In: Atmospheric Chemistry and Physics . tape 10 , 2010, doi : 10.5194 / acp-10-1885-2010 .
- ↑ T Sloan, AW Wolfendale: Testing the Proposed causal link between cosmic rays and cloud cover . In: Environmental Research Letters . tape 3 , 2008, doi : 10.1088 / 1748-9326 / 3/2/024001 .
- ↑ JR Pierce: Cosmic rays, aerosols, clouds, and climate: Recent findings from the CLOUD experiment . In: Journal of Geophysical Research: Atmospheres . tape 122 , 2017, doi : 10.1002 / 2017JD027475 .
- ↑ Hamish Gordon et al .: Causes and importance of new particle formation in the present-day and preindustrial atmospheres . In: Journal of Geophysical Research: Atmospheres . tape 122 , 2017, doi : 10.1002 / 2017JD026844 .
- ↑ G. Myhre, D. Shindell, F.-M. Bréon, W. Collins, J. Fuglestvedt, J. Huang, D. Koch, J.-F. Lamarque, D. Lee, B. Mendoza, T. Nakajima, A. Robock, G. Stephens, T. Takemura and H. Zhan: Anthropogenic and Natural Radiative Forcing . In: TF Stocker u. a. (Ed.): Climate Change 2013: The Physical Science Basis. Contribution of Working Group I to the Fifth Assessment Report of the Intergovernmental Panel on Climate Change . 2013, 8.4.1.5 The Effects of Cosmic Rays on Clouds, p. 691.
- ^ Brian J. Soden, Richard T. Wetherald, Georgiy L. Stenchikov, Alan Robock: Global Cooling After the Eruption of Mount Pinatubo: A Test of Climate Feedback by Water Vapor . (PDF) In: Science . 296, April 2002, pp. 727-730. doi : 10.1126 / science.296.5568.727 .
- ↑ John Fasullo, Andrew Schurer, Luke Barnard, Gareth S. Jones, Ilya Usoskin: The Maunder minimum and the Little Ice Age: an update from recent reconstructions and climate simulations . In: Journal of Space Weather and Space Climate . tape 7 , 2017, ISSN 2115-7251 , p. A33 , doi : 10.1051 / swsc / 2017034 ( swsc-journal.org [accessed August 16, 2019]).
- ↑ Christoph C. Raible, Julian Flückiger, Abdul Malik, Matthias Worni, Andrew Schurer: Last phase of the Little Ice Age forced by volcanic eruptions . In: Nature Geoscience . tape 12 , no. 8 , August 2019, ISSN 1752-0908 , p. 650–656 , doi : 10.1038 / s41561-019-0402-y ( nature.com [accessed August 16, 2019]).
- ↑ Solar activity was not to blame for the “little ice age” . In: scinexx | The knowledge magazine . September 2, 2011 ( scinexx.de [accessed on August 16, 2019]).
- ^ Vicky Hards: Volcanic Contributions to the Global Carbon Cycle . Ed .: British Geological Survey. No. 10 , 2005 ( bgs.ac.uk ).
- ↑ Urs Neu: Claim: "Volcanoes emit more carbon dioxide than humans". November 3, 2015, accessed August 16, 2019 .
- ^ JT Kiehl, Kevin E. Trenberth: Earth's Annual Global Mean Energy Budget . In: Bulletin of the American Meteorological Society . tape 78 , no. 2 , February 1997, p. 197–208 ( utexas.edu [PDF; accessed August 16, 2019]).
- ↑ Michael Ponater: How water vapor increases warming. In: World of Physics. July 15, 2010, accessed August 16, 2019 .
- ↑ Water vapor feedback and temperature gradient feedback - climate change. Retrieved August 16, 2019 .
- ^ Isaac M. Held, Brian J. Soden: Water Vapor Feedback and Global Warming . In: Annual Review of Energy and the Environment . tape 25 , no. 1 , November 1, 2000, ISSN 1056-3466 , p. 441–475 , doi : 10.1146 / annurev.energy.25.1.441 ( annualreviews.org [accessed August 16, 2019]).
- ^ A b Flanner, MG: Integrating anthropogenic heat flux with global climate models . In: Geophys. Res. Lett. . 36, No. 2, 2009, p. L02801. bibcode : 2009GeoRL..3602801F . doi : 10.1029 / 2008GL036465 .
- ^ Block, A., K. Keuler, and E. Schaller: Impacts of anthropogenic heat on regional climate patterns . In: Geophys. Res. Lett. . 31, No. 12, 2004, p. L12211. bibcode : 2004GeoRL..3112211B . doi : 10.1029 / 2004GL019852 .
- ↑ Berg, Matthew, et al., A stock-flow consistent input-output model with applications to energy price shocks, interest rates, and heat emissions. New J. Phys. 17 (2015) 015011 doi: 10.1088 / 1367-2630 / 17/1/015011
- ^ Arnold, H .: Global Warming by Anthropogenic Heat, a Main Problem of Fusion Techniques . (PDF) In: Digital Library Thuringia . 2016, pp. 1–16.
- ↑ Xiaochun Zhang, Ken Caldeira: Time scales and ratios of climate forcing due to thermal versus carbon dioxide emissions from fossil fuels . In: Geophysical Research Letters . tape 42 , no. 11 , 2015, p. 4548–4555 , doi : 10.1002 / 2015GL063514 .
- ↑ Weather and Climate - German Weather Service - Urban Warmth Island. German Weather Service, accessed on August 16, 2019 .
- ↑ Reto Knutti: How do we measure global warming? ETH Zurich, June 23, 2015, accessed on August 16, 2019 .
- ↑ Stefan Rahmstorf: The absolute global mean temperature. In: KlimaLounge. Spektrum.de, February 12, 2018, accessed on August 16, 2019 (German).
- ^ Thomas C. Peterson: Assessment of Urban Versus Rural In Situ Surface Temperatures in the Contiguous United States: No Difference Found . In: Journal of Climate . tape 16 , no. 18 , September 1, 2003, ISSN 0894-8755 , p. 2941-2959 , doi : 10.1175 / 1520-0442 (2003) 0162.0.CO; 2 .
- ↑ Thomas C. Peterson, Kevin P. Gallo, Jay Lawrimore, Timothy W. Owen, Alex Huang: Global rural temperature trends . In: Geophysical Research Letters . tape 26 , no. 3 , 1999, ISSN 1944-8007 , pp. 329-332 , doi : 10.1029 / 1998GL900322 .
- ^ Schneider von Deimling, Thomas; Andrey Ganopolski, Hermann Held, Stefan Rahmstorf (2006): How cold was the Last Glacial Maximum? In: Geophysical Research Letters, Vol. 33, L14709, doi: 10.1029 / 2006GL026484 ( PDF; 731 kB )
- ↑ J. Hansen: Earth's Energy Imbalance: Confirmation and Implications. In: Science. 308, 2005, p. 1431, doi: 10.1126 / science.1110252 .
- ↑ Kevin E. Trenberth, John T. Fasullo, Jeffrey Kiehl: Earth's global energy budget, Bulletin of the American Meteorological Society doi: 10.1175 / 2008BAMS2634.1 online (PDF; 900 kByte) ( Memento from June 24, 2008 in the Internet Archive )
- ↑ William J. Ripple, Christopher Wolf, Thomas M. Newsome, Mauro Galetti, Mohammed Alamgir, Eileen Crist, Mahmoud I. Mahmoud, William F. Laurance and 15,364 life scientists from 184 countries: World Scientists' Warning to Humanity: A Second Notice . In: BioScience . tape 67 , no. 12 , 2017, p. 1026-1028 , doi : 10.1093 / biosci / bix125 .
- ↑ Nerilie J. Abram, Helen V. McGregor, Jessica E. Tierney, Michael N. Evans, Nicholas P. McKay, Darrell S. Kaufman, Kaustubh Thirumalai, Belen Martrat, Hugues Goosse, Steven J. Phipps, Eric J. Steig, K. Halimeda Kilbourne, Casey P. Saenger, Jens Zinke, Guillaume Leduc, Jason A. Addison, P. Graham Mortyn, Marit-Solveig Seidenkrantz, Marie-Alexandrine Sicre, Kandasamy Selvaraj, Helena L. Filipsson, Raphael Neukom, Joelle Gergis, Mark AJ Curran, Lucien von Gunten: Early onset of industrial-era warming across the oceans and continents . In: Nature . 536, No. 7617, August 24, 2016, p. 411. doi : 10.1038 / nature19082 .
- ↑ 2017 was the second warmest year , Klimaretter.info, January 6, 2018
- ↑ Copernicus also measures 1.5 degrees. In: klimaretter.info, January 12, 2017
- ↑ Summary for Policymakers. In: Climate Change 2013: The Physical Science Basis. Contribution of Working Group I to the Fifth Assessment Report of the Intergovernmental Panel on Climate Change. (PDF) IPCC, 2013, accessed on August 31, 2014 . page 5
- ↑ Darrell Kaufman, Nicholas McKay, Cody Routson, Michael Erb, Christoph Dätwyler, Philipp S. Sommer, Oliver Heiri, Basil Davis: Holocene global mean surface temperature, a multi-method reconstruction approach . In: Nature Scientific Data . June 7, 2020. doi : 10.1038 / s41597-020-0530-7 .
- ↑ Ammann, Caspar M., Fortunat Joos, David S. Schimel, Bette L. Otto-Bliesner, Robert A. Tomas (2007): Solar influence on climate during the past millennium: Results from transient simulations with the NCAR Climate System Model. In: PNAS, Vol. 104, pp. 3713-3718, doi: 10.1073 / pnas.0605064103
- ↑ John A. Church, Neil J. White, Leonard F. Konikow, Catia M. Domingues, J. Graham Cogley, Eric Rignot , Jonathan M. Gregory, Michiel R. van den Broeke, Andrew J. Monaghan, Isabella Velicogna: Revisiting the Earth's sea-level and energy budgets from 1961 to 2008 . In: Geophysical Research Letters . 38, No. 18, September 2011, pp. 1944-2007. doi : 10.1029 / 2011GL048794 .
- ^ Scientific Advisory Board of the Federal Government on Global Change (Ed.): The future of the seas - too warm, too high, too acidic . Special report. Berlin 2006 ( wbgu.de ).
- ↑ S. Levitus: Warming of the world ocean, 1955-2003. In: Geophysical Research Letters. 32, 2005, doi: 10.1029 / 2004GL021592 .
- ^ NOAA celebrates 200 years of science, service and stewardship, Top 10: Breakthroughs: Warming of the World Ocean Online
- ↑ Stefan Rahmstorf , Katherine Richardson : How threatened are the oceans? In: Klaus Wiegandt (Ed.): Courage for Sustainability. 12 ways into the future . Frankfurt am Main 2016, 113-146, p. 116.
- ↑ Lijing Cheng, John Abraham et al. a .: Record-Setting Ocean Warmth Continued in 2019. In: Advances in Atmospheric Sciences. 37, 2020, p. 137, doi: 10.1007 / s00376-020-9283-7 .
- ↑ NASA Goddard Institute for Space Studies: Temperature Anomalies in different regions
- ^ Met Office : Observing Changes in the Climate. PDF ( Memento from November 29, 2013 in the Internet Archive )
- ↑ IPCC 2018: Chap. 1: Framing and Context, p. 81 . Special report 1.5 ° C global warming . Retrieved April 20, 2019.
- ↑ Hemispheric Temperature Change. 1880 to 2007, NASA.
- ↑ Russell S. Vose et al. a. (2005): Maximum and minimum temperature trends for the globe: An update through 2004. In: Geophysical Research Letters, Vol. 32, L23822. doi: 10.1029 / 2005GL024379 (PDF; 241 kB)
- ↑ LV Alexander u. a. (2006): Global observed changes in daily climate extremes of temperature and precipitation. In: Journal of Geophysical Research Vol. 111, D05109, doi: 10.1029 / 2005JD006290
- ^ GISS Surface Temperature Analysis. NASA
- ↑ a b c Intergovernmental Panel on Climate Change (2007): IPCC Fourth Assessment Report - Working Group I Report "The Physical Science Basis", Chapter 3: Observations: Surface and Atmospheric Climate Change ( PDF; 25.3 MB )
- ^ Arctic Climate Impact Assessment (2004): Arctic Climate Impact Assessment. Cambridge University Press, ISBN 0-521-61778-2 , see online
- ↑ Intergovernmental Panel on Climate Change (2007): Report of Working Group II, Impacts, Adaptation and Vulnerability. Chapter 15: Polar Regions (PDF; 1017 kB) (English)
- ↑ a b U.S. Climate Change Science Program (2006): Temperature Trends in the Lower Atmosphere. Steps for Understanding and Reconciling Differences ( PDF )
- ↑ Remote Sensing Systems Upper Air Temperature ( Memento from November 23, 2012 in the Internet Archive )
- ↑ Elmar Uherek: Stratospheric cooling. ESPERE-ENC Climate Encyclopedia (Max Planck Institute for Chemistry, Mainz), May 11, 2004 ( Memento from October 18, 2006 in the Internet Archive )
- ↑ V. Ramaswamy, MD Schwarzkopf, WJ Randel (1996): Fingerprint of ozone depletion in the spatial and temporal pattern of recent lower-stratospheric cooling. In: Nature. Vol. 382, pp. 616-618, August 15, see abstract online
- ↑ Climate at a Glance - Land & Ocean. NOAA, accessed January 16, 2019
- ^ Climate at a Glance - Land. NOAA, accessed January 16, 2019
- ^ "Despite the robust multi-decadal warming, there exists substantial interannual to decadal variability in the rate of warming, with several periods exhibiting weaker trends (including the warming hiatus since 1998) ... Fifteen-year-long hiatus periods are common in both the observed and CMIP5 historical GMST time series "," Box TS.3: Climate Models and the Hiatus in Global Mean Surface Warming of the Past 15 Years ", IPCC, Climate Change 2013: Technical Summary , p. 37 and pp. 61-63.
- ↑ The Copenhagen Diagnosis (2009): Updating the World on the Latest Climate Science. I. Allison, NL Bindoff, R. Bindschadler , PM Cox, N. de Noblet, MH England, JE Francis, N. Gruber, AM Haywood, DJ Karoly, G. Kaser, C. Le Quéré, TM Lenton, ME Mann, BI McNeil, AJ Pitman, S. Rahmstorf, Eric Rignot , HJ Schellnhuber, SH Schneider, SC Sherwood, RCJ Somerville, K. Steffen, EJ Steig, M. Visbeck, AJ Weaver. The University of New South Wales Climate Change Research Center (CCRC), Sydney, Australia, 60pp, ( PDF; 3.5 MB )
- ↑ Kevin E. Trenberth, John T. Fasullo: An apparent hiatus in global warming? . In: Earth's Future . 1, No. 1, December 2013, ISSN 2328-4277 , pp. 19-32. doi : 10.1002 / 2013EF000165 .
- ↑ Kristina Pistone, Ian Eisenman, Veerabhadran Ramanathan: Radiative Heating of an Ice-Free Arctic Ocean . In: Geophysical Research Letters . tape 46 , no. 13 , 2019, ISSN 1944-8007 , p. 7474–7480 , doi : 10.1029 / 2019GL082914 .
- ↑ a b c d NASA Facts (1999): Clouds and the Energy Cycle ( Memento from June 30, 2007 in the Internet Archive ) (PDF; 87 kB)
- ↑ Fewer clouds through more carbon dioxide. September 3, 2012. Press release from the Max Planck Society
- ↑ Jordi Vilà-Guerau de Arellano, Chiel C. van Heerwaarden, Jos Lelieveld: Modeled suppression of boundary-layer clouds by plants in a CO2-rich atmosphere . In: Nature Geoscience . tape 5 , 2012, p. 701-704 , doi : 10.1038 / ngeo1554 ( researchgate.net ).
- ^ Mark D. Zelinka, David A. Randal, Mark J. Webb and Stephen A. Klein: Clearing clouds of uncertainty . In: Nature Climate Change . 2017, doi : 10.1038 / nclimate3402 .
- ↑ O. Boucher et al. a .: Clouds and Aerosols . In: TF Stocker et al. (Ed.): Climate Change 2013: The Physical Science Basis. Contribution of Working Group I to the Fifth Assessment Report of the Intergovernmental Panel on Climate Change . 2013, Executive Summary, p. 574 : "The sign of the net radiative feedback due to all cloud types is [...] likely positive"
- ^ Tapio Schneider, Colleen M. Kaul, Kyle G. Pressel: Possible climate transitions from breakup of stratocumulus decks under greenhouse warming. In: Nature Geoscience. 12, 2019, p. 163, doi: 10.1038 / s41561-019-0310-1 .
- ↑ Marlene Weiß: Back to the Cretaceous Period . In: sueddeutsche.de . February 27, 2019, ISSN 0174-4917 ( sueddeutsche.de [accessed July 2, 2019]).
- ↑ ESPERE-ENC: The contribution of agriculture to greenhouse gases ( Memento of April 8, 2014 in the Internet Archive )
- ^ Stocker, TF et al .: Technical Summary . In: Climate Change 2013: The Physical Science Basis. Contribution of Working Group I to the Fifth Assessment Report of the Intergovernmental Panel on Climate Change . 2013, Climate Feedbacks, p. 57 f . ( ipcc.ch [PDF]): "Models and ecosystem warming experiments show high agreement that wetland CH4 emissions will increase per unit area in a warmer climate, [...]"
- ↑ Gregory Ryskin: Methane-driven oceanic eruptions and mass extinctions. ( Memento of August 28, 2008 in the Internet Archive ) In: Geology. September 2003; v. 31; no. 9; Pp. 741-744.
- ↑ Ellen Thomas .
- ↑ Climate warning as Siberia melts. In: New Scientist . August 11, 2005.
- ↑ Methane Thrower Permafrost - Wissenschaft.de . In: Wissenschaft.de . March 20, 2018 ( Wissenschaft.de [accessed March 6, 2019]).
- ↑ Frontiers 2018/19: Emerging Issues of Environmental Concern. Retrieved March 6, 2019 .
- ↑ Craig Welch: Arctic permafrost is thawing fast. That affects us all. In: National Geographic. August 13, 2019, accessed on August 25, 2019 .
- ↑ Feedback Loops in Global Climate Change Point to a Very Hot 21st Century. Online Version In: Berkeley Lab Research News. 2006.
- ↑ Barrie Pittock: Are Scientists Underestimating Climate Change? In: Eos. Vol. 87, No. 34, August 22, 2006, pp. 340–341 ( PDF; 589 kB ( Memento from February 1, 2014 in the Internet Archive ))
- ↑ a b IPCC: Climate Change 2014: Synthesis Report . German translation by the German IPCC coordination office. Ed .: main authors, RK Pachauri and LA Meyer. IPCC, Geneva & Bonn 2016, ISBN 978-3-89100-047-2 ( de-ipcc.de [PDF]).
- ↑ Leggett, Jeremy: Dangerous Fiction. Review of Michael Crichton 's State of Fear. New Scientist 2489, March 5, 2005, p. 50
- ^ Suess, Hans E. (1956): Absolute Chronology of the Last Glaciation. In: Science 123: 355-357
- ↑ Katharine L Ricke, Ken Caldeira : Maximum warming occurs about one decade after a carbon dioxide emission . In: Environmental Research Letters . 9, No. 12, December 1, 2014, ISSN 1748-9326 , p. 124002. doi : 10.1088 / 1748-9326 / 9/12/124002 .
- ↑ Home - Climate Action Tracker . climateactiontracker.org.
- ↑ Susan Solomon, Gian-Kasper Plattner, Reto Knutti , Pierre Friedlingstein: Irreversible climate change due to carbon dioxide emissions. Proceedings of the National Academy of Sciences doi: 10.1073 / pnas.0812721106 Online (PDF)
- ↑ G.-K. Plattner, Reto Knutti a . a .: Long-Term Climate Commitments Projected with Climate-Carbon Cycle Models. In: Journal of Climate. 21, 2008, p. 2721, doi: 10.1175 / 2007JCLI1905.1 .
- ^ Mason Inman: Carbon is forever. In: Encyclopedia of Things. Nature reports, November 20, 2008, accessed September 12, 2012 .
- ↑ Katarzyna B. Tokarska et al .: The climate response to five trillion tonnes of carbon . In: Nature Climate Change . tape 6 , 2016, p. 851-855 , doi : 10.1038 / nclimate3036 .
- ^ Gavin L. Foster et al .: Future climate forcing potentially without precedent in the last 420 million years . In: Nature Communications . tape 8 , 2017, doi : 10.1038 / ncomms14845 .
- ↑ Ricarda Winkelmann et al .: Combustion of available fossil fuel resources sufficient to eliminate the Antarctic Ice Sheet . In: Science Advances . tape 1 , no. 8 , 2015, doi : 10.1126 / sciadv.1500589 .
- ↑ Vienna gets as hot as Skopje , orf.at, 2019-07-11.
- ↑ Cities of the future: visualizing climate change to inspire action, current vs future cities , Crowther Lab, Department for Environmental Systems Science, Institute for Integrative Biology, ETH Zurich, accessed: 2019-07-11.
- ↑ Understanding climate change from a global analysis of city analogues , Bastin JF, Clark E, Elliott T, Hart S, van den Hoogen J, Hordijk I, et al. (2019), PLoS ONE 14 (7): e0217592, Crowther Lab, Department for Environmental Systems Science, Institute for Integrative Biology, ETH Zurich, 2019-07-10.
- ^ Roland Jackson: Eunice Foote, John Tyndall and a Question of Priority . (PDF) In: Notes and Records (The Royal Society Journal of the History of Science) . 2019. doi : 10.1098 / rsnr.2018.0066 .
- ↑ Jaime Wisniak: Svante Arrhenius and the Greenhouse Effect. In: Indian Journal of Chem Technology 9 (2002), pp. 165-173.
- ^ Svante Arrhenius (1896): On the Influence of Carbonic Acid in the Air upon the Temperature of the Ground. In: Philosophical Magazine and Journal of Science , Vol. 41, pp. 239–276 ( PDF; 8 MB ( Memento from October 6, 2014 in the Internet Archive ))
- ^ The Royal Society of London E. Gold: The Isothermal Layer of the Atmosphere and Atmospheric Radiation (February 16, 1909)
- ↑ BD Santer, MF Wehner a. a .: Contributions of anthropogenic and natural forcing to recent tropopause height changes. In: Science. Volume 301, Number 5632, July 2003, pp. 479-483, doi: 10.1126 / science.1084123 , PMID 12881562 .
- ^ The Carbon Dioxide Theory of Climatic Change. GN Plass, Tellus 8, pp. 140–154, 1956 ( PDF )
- ^ Charney Report Carbon Dioxide and Climate: A Scientific Assessment. ( Memento from December 21, 2016 in the Internet Archive ) In: Report of an Ad Hoc Study Group on Carbon Dioxide and Climate Woods Hole. Massachusetts, Jan. 23-27 July 1979 (PDF, pp. 2 f. And 10 f.)
- ↑ Ben Block: A look back at James Hansen's seminal testimony on climate. Grist, 2008
- ^ Philip Shabecoff: Global Warming Has Begun, Expert Tells Senate. New York Times, June 24, 1988
- ^ Svante Arrhenius: On the Influence of Carbonic Acid in the Air upon the Temperature of the Ground . In: Philosophical Magazine and Journal of Science 41, 1896, pp. 239–276 globalwarmingart.com ( Memento from October 6, 2014 in the Internet Archive ) (PDF; 8 MB)
- ↑ Wiliam L. Donn, David M. Shaw: Model of climate evolution based on continental drift and polar wandering . In: Bulletin . 88, No. 3, March 1977, pp. 390-396. doi : 10.1130 / 0016-7606 (1977) 88 <390: MOCEBO> 2.0.CO; 2 .
- ↑ Gerald H. Haug, Lloyd D. Keigwin: How the Isthmus of Panama Put Ice in the Arctic: Drifting continents open and close gateways between oceans and shift Earth's climate. In: Oceanus. Woods Hole Oceanographic Institution, accessed July 22, 2013 .
- ↑ JCG Walker, PB Hays, JF Kasting: A Negative Feedback Mechanism for the Long-term Stabilization of Earth's Surface Temperature Archived from the original on October 22, 2013. (pdf) In: J. Geophys. Res. . 86, 1981, pp. 1,147-1,158. doi : 10.1029 / JC086iC10p09776 .
- ^ Hoffman, PF, Kaufman, AJ, Halverson, GP, Schrag, DP: A Neoproterozoic Snowball Earth . In: Science . 281, No. 5381, August 28, 1998, pp. 1342-6. bibcode : 1998Sci ... 281.1342H . doi : 10.1126 / science.281.5381.1342 . PMID 9721097 . ( PDF; 260 kB )
- ^ Georg Feulner: Formation of most of our coal brought Earth close to global glaciation . In: PNAS . 114, No. 43, October 2017, pp. 11333–11337. doi : 10.1073 / pnas.1712062114 .
- ^ A b Yadong Sun, Michael M. Joachimski, Paul B. Wignall, Chunbo Yan, Yanlong Chen, Haishui Jiang, Lina Wang, Xulong Lai: Lethally Hot Temperatures During the Early Triassic Greenhouse . In: Science . Lethally Hot Temperatures During the Early Triassic Greenhouse, No. 366, October 2012. doi : 10.1126 / science.1224126 .
- ↑ a b Michael M. Joachimski, Xulong Lai, Shuzhong Shen, Haishui Jiang, Genming Luo, Bo Chen, Jun Chen and Yadong Sun: Climate warming in the latest Permian and the Permian – Triassic mass extinction . In: Geology . 40, No. 3, January 2012, pp. 195-198. doi : 10.1130 / G32707.1 .
- ↑ a b Gabriel Bowen, Timothy J. Bralower, Margareth L. Delaney, Gerald R. Dickens, Daniel C. Kelly, Paul L. Koch, Lee R. Kump, Jin Meng, Lisa C. Sloan, Ellen Thomas, Scott L. Wing, James C. Zachos: Eocene hyperthermal event offers insight into greenhouse warming . In: EOS . 87, No. 17, June 2011, pp. 165-169. doi : 10.1029 / 2006EO170002 .
- ^ Peter Ward: Under a Green Sky: Global Warming, the Mass Extinctions of the Past, and What They Can Tell Us About Our Future (2007) ISBN 978-0-06-113791-4
- ^ Joan Feynman, Alexander Ruzmaikin: Climate stability and the development of agricultural societies . In: Climatic Change . 84, No. 3-4, 2007, pp. 295-311. doi : 10.1007 / s10584-007-9248-1 .
- ↑ NASA Earth Observatory: How is Today's Warming Different from the Past? II. In: Global Warming. June 3, 2010, accessed January 21, 2014 .
- ↑ Hartmut Graßl : Climate Change. The most important answers . Freiburg im Breisgau 2007, p. 63f
- ↑ Mark Pagani, Zhonghui Liu, Jonathan LaRiviere, Ana Christina Ravelo: High Earth-system climate sensitivity determined from Pliocene carbon dioxide concentrations . (PDF) In: Nature Geoscience . 3, 2010. doi : 10.1038 / ngeo724 . , accessed October 8, 2015
- ↑ World Cup Kurschner, J. van der Burgh H. Visscher, DL Dilcher: Oak leaves as biosensors of late Neogene and early Pleistocene paleoatmospheric CO 2 Concentrations . In: Marine Micropaleontology . 27, No. 1-4, 1996, pp. 299-312. doi : 10.1016 / 0377-8398 (95) 00067-4 .
- ↑ IPCC: 6.3.2 What Does the Record of the Mid-Pliocene Show? . In: Climate Change 2007: Working Group I: The Physical Science Basis . Cambridge University Press, 2007: "Geologic evidence and isotopes agree that sea level was at least 15 to 25 m above modern levels."
- ↑ Michael E. Mann , Tom Toles: The madhouse effect. How climate change denial threatens our planet, destroys our politics and drives us insane . Erlangen 2018, p. 59.
- ↑ Veerabhadran Ramanathan , JA Coakley: Relative contributions of H 2 0, CO 2 and 0 3 to the greenhouse effect . In: Rev. Geophys and Space Phys . tape 16 , 1978, p. 465 .
- ^ Robin Haunschild et al .: Climate Change Research in View of Bibliometrics . In: PLOS ONE . tape 11 , no. 7 , 2016, doi : 10.1371 / journal.pone.0160393 .
- ↑ John Cook et al .: Quantifying the consensus on anthropogenic global warming in the scientific literature . In: Environmental Research Letters . 2013. doi : 10.1088 / 1748-9326 / 8/2/024024 .
- ^ Dan Satterfield: IPCC Climate Forecast from 1990- Amazingly Accurate (English) , AGU.
- ↑ John Cook: Climate models have long been able to reconstruct the temperature behavior of the earth (German) , Klimafakten.de.
- ^ Smith et al .: Variations on Reliability: Connecting Climate Predictions to Climate Policy (English) , Center for the Analysis of Time Series.
- ↑ Patrick T. Brown, Ken Caldeira: Greater future global warming inferred from Earth's recent energy budget. Nature 552, 2017, doi: 10.1038 / nature24672 (free full text).
- ↑ Global Warming: Is the Science Settled Enough for Policy? Lecture by Stephen Schneider at the Stanford University Office Science Outreach Summer Science lecture Youtube
- ↑ Maxwell T. Boykoff: Public Enemy No. 1? Understanding Media Representations of Outlier Views on Climate Change . In: American Behavioral Scientist . tape 57 , no. 6 , 2013, p. 796-817 , doi : 10.1177 / 0002764213476846 .
- ^ Naomi Oreskes : The Scientific Consensus on Climate Change . In: Science . tape 306 , no. 5702 , 2004, p. 1686 , doi : 10.1126 / science.1103618 .
- ↑ Anderegg et al .: Expert credibility in climate change . In: Proceedings of the National Academy of Sciences . tape 107 , no. 27 , 2010, p. 12107-12109 , doi : 10.1073 / pnas.1003187107 .
- ↑ Uri Shwed, Peter S. Bearman: The Temporal Structure of Scientific Consensus formation . In: American Sociological Review . tape 75 , no. 6 , 2010, p. 817-840 , doi : 10.1177 / 0003122410388488 .
- ↑ German Bundestag 1988: First interim report of the ENQUETE COMMISSION Provision for the protection of the earth's atmosphere, p. 177 . Website of the German Bundestag. Retrieved August 15, 2019.
- ^ A b Royal Society (2001): The Science of Climate Change Online
- ↑ The National Academies (2007): Joint science academies' statement on growth and responsibility: sustainability, energy efficiency and climate protection ( PDF; 198 kB )
- ↑ The National Academies (2008): Joint Science Academies' Statement: Climate Change Adaptation and the Transition to a Low Carbon Society ( PDF; 198 kB )
- ↑ See also the English Wikipedia article Scientific opinion on climate change
- ^ Advancing the Science of Climate Change . National Research Council, Washington, DC 2010, ISBN 978-0-309-14588-6 (English, nap.edu ).
- ↑ IPCC, 2014: Climate Change 2014: Synthesis Report. Contribution of Working Groups I, II and III to the Fifth Assessment Report of the Intergovernmental Panel on Climate Change [Core Writing Team, RK Pachauri and LA Meyer (eds.)]. IPCC, Geneva, Switzerland, 151 pp.
- ^ What we know - AAAS information initiative
- ↑ Philip Kokic, Steven Crimp, Mark Howden: A probabilistic analysis of human influence on recent record global mean temperature changes. Climate Risk Management 3, 2014, pp. 1–12, doi: 10.1016 / j.crm.2014.03.002 .
- ↑ a b Karin Edvardsson Björnberg et al: Climate and environmental science denial: A review of the scientific literature published in 1990-2015 . In: Journal of Cleaner Production . tape 167 , 2017, p. 229-241 , doi : 10.1016 / j.jclepro.2017.08.066 .
- ^ Sven Ove Hansson: Science denial as a form of pseudoscience . In: Studies in History and Philosophy of Science . tape 63 , 2017, p. 39–47 , doi : 10.1016 / j.shpsa.2017.05.002 .
- ↑ Naomi Oreskes , Erik M. Conway : Die Machiavellis der Wissenschaft (Original: Merchants of Doubt: How a Handful of Scientists Obscured the Truth on Issues from Tobacco Smoke to Global Warming). Weinheim 2014, p. XXII.
- ^ Paul C. Stern: Sociology. Impacts on climate change views . In: Nature Climate Change . tape 6 , 2016, p. 341-342 , doi : 10.1038 / nclimate2970 .
- ↑ Constantine Boussalis, Travis G. Coan: Text-mining the signals of climate change doubt . In: Global Environmental Change . tape 36 , 2016, p. 89–100 , doi : 10.1016 / j.gloenvcha.2015.12.001 .
- ^ Riley E. Dunlap and Peter J. Jacques: Climate Change Denial Books and Conservative Think Tanks: Exploring the Connection . In: American Behavioral Scientist . tape 57 , no. 6 , 2013, p. 699-731 , doi : 10.1177 / 0002764213477096 .
- ↑ Naomi Oreskes , Erik M. Conway : Die Machiavellis der Wissenschaft (Original: Merchants of Doubt: How a Handful of Scientists Obscured the Truth on Issues from Tobacco Smoke to Global Warming ), Weinheim 2014.
- ^ Robert J. Brulle: Institutionalizing delay: foundation funding and the creation of US climate change counter-movement organizations . In: Climatic Change . 2013, doi : 10.1007 / s10584-013-1018-7 .
- ↑ Kirsti M. Jylhä: Denial Versus Reality of Climate Change . In: Dominick A. DellaSala, Michael A. Goldstein (Eds.) Encyclopedia of the Anthropocene, Volume 2. Climate Change . Elsevier 2018, 487-492, p. 487 doi: 10.1016 / B978-0-12-809665-9.09762-7 .
- ↑ IPCC 2018 Summary for Policy Makers, p 7 . Special report 1.5 ° C global warming . Retrieved April 20, 2019.
- ^ Haydn Washington, John Cook: Climate Change Denial. Heads in the sand . Earthscan 2011, p. 107f.
- ↑ Four Degree Dossier for the World Bank: Risks of a Future Without Climate Protection. In: Potsdam Institute for Climate Impact Research. November 19, 2012, accessed on January 20, 2013 (complete version of the report “Turn down the heat”, available online, PDF, 14.38 MB ).
- ↑ Timothy M. Lenton, Hermann Held, Elmar Kriegler, Jim W. Hall, Wolfgang Lucht, Stefan Rahmstorf, Hans Joachim Schellnhuber: Tipping elements in the Earth's climate system . In: Proceedings of the National Academy of Sciences . tape 105 , no. 6 , 2008, p. 1786-1793 , doi : 10.1073 / pnas.0705414105 .
- ↑ 3. The global conveyor belt and global warming in the tutorial on ocean currents of the SEOS Project; accessed on September 23, 2016
- ↑ Jonathan Watts: Risks of 'domino effect' of tipping points greater than thought, study says . In: The Guardian . December 20, 2018, ISSN 0261-3077 ( theguardian.com [accessed March 13, 2019]).
- ↑ National Academies of Science: Abrupt Impacts of Climate Change - Anticipating Surprises ( PDF )
- ↑ a b National Research Council : Abrupt Climate Change: Inevitable Surprises . National Academy Press, Washington DC 2002, ISBN 978-0-309-07434-6 , pp. 27 ( nap.edu ).
- ↑ Wuebbles, DJ, DW Fahey, KA Hibbard, DJ Dokken, BC Stewart, and TK Maycock: USGCRP, 2017: Climate Science Special Report: Fourth National Climate Assessment, Volume I. In: science2017.globalchange.gov. United States, 2017, accessed March 18, 2018 .
- ^ Carlos Nobre, Thomas E. Lovejoy: Amazon Tipping Point . In: Science Advances . tape 4 , no. 2 , February 1, 2018, ISSN 2375-2548 , p. eaat2340 , doi : 10.1126 / sciadv.aat2340 ( sciencemag.org [accessed August 25, 2019]).
- ^ Hare, William (2003): Assessment of Knowledge on Impacts of Climate Change - Contribution to the Specification of Art. 2 of the UNFCCC. External expertise for the WBGU special report “World in Transition: Thinking beyond Kyoto. Climate protection strategies for the 21st century "( PDF; 1.7 MB )
- ↑ IPCC 2018 Summary for Policy Makers, p 10 . Special report 1.5 ° C global warming . Retrieved April 20, 2019.
- ↑ Hare, William (2005): Relationship between increases in global mean temperature and impacts on ecosystems, food production, water and socio-economic systems ( PDF; 1.2 MB )
- ↑ Ramakrishna R. Nemani et al. a. (2003): Climate-Driven Increases in Global Terrestrial Net Primary Production from 1982 to 1999. In: Science 300 (5625), pp. 1560-1563 doi: 10.1126 / science.1082750
- ↑ Della-Marta, PM, MR Haylock, J. Luterbacher, H. Wanner (2007): Doubled length of western European summer heat waves since 1880. In: Journal of Geophysical Research, Vol. 112, D15103, doi: 10.1029 / 2007JD008510
- ^ The Lancet: Health and Climate Change , November 25, 2009
- ↑ WWF & IfW (2007): Costs of Climate Change - The Effect of Rising Temperatures on Health and Performance ( PDF; 5.1 MB )
- ^ WR Keatinge & GC Donaldson: The Impact of Global Warming on Health and Mortality. In: Southern Medical Journal 97 (11), pp. 1093-1099, November 2004. online
- ↑ PIK Potsdam: Global warming could make winter colder
- ^ Climate change and health. World health organization
- ↑ P. Martens, RS Kovats, S. Nijhof, P. de Vries, MTJ Livermore, DJ Bradley, J. Cox, AJ McMichael (1999): Climate change and future populations at risk of malaria. In: Global Environmental Change. Volume 9, Supplement 1, October, pp. S89-S107 doi: 10.1016 / S0959-3780 (99) 00020-5 .
- ↑ Marco Springmann u. a .: Global and regional health eff ects of future food production under climate change: a modeling study . In: The Lancet . tape 387 , no. 10031 , 2016, p. 1937-1946 , doi : 10.1016 / S0140-6736 (15) 01156-3 .
- ↑ P. Martens et al. a .: Climate change and future populations at risk of malaria. In: Global Environmental Change. Vol. 9, Supplement 1 (1999), pp. 89-107 doi: 10.1016 / S0959-3780 (99) 00020-5 .
- ↑ M. van Lieshout et al. a .: Climate change and malaria: analysis of the SRES climate and socio-economic scenarios. In: Global Environmental Change Vol. 14, Issue 1 (2004), pp. 87-99 doi: 10.1016 / j.gloenvcha.2003.10.009 .
- ^ NASA Data Show Some African Drought Linked to Warmer Indian Ocean. NASA, August 5, 2008
- ^ New Economics Foundation and International Institute for Environment and Development (2005): Africa - Up in Smoke? The Second Report From the Working Group on Climate Change and Development. London ( PDF; 1.4 MB ( memento of August 8, 2012 in the Internet Archive ))
- ↑ Kerstin S. Treydte u. a .: The twentieth century was the wettest period in northern Pakistan over the past millennium. In: Nature 440 (2006), pp. 1179-1182. doi: 10.1038 / nature04743
- ↑ PCD Milly, RT Wetherald, KA Dunne, TL Delworth: Increasing risk of great floods in a changing climate. In: Nature. January 31, 2002, pp. 514-517, v. 415, doi: 10.1038 / 415514a .
- ↑ Kevin Trenberth, Aiguo Dai, Roy M. Rasmussen, David B. Parsons: The Changing Pattern of Precipitation. In: Bulletin of the American Meteorological Society. September 2003, pp. 1205–1217, doi: 10.1175 / BAMS-84-9-1205 ( PDF; 2.2 MB )
- ↑ Michael Oppenheimer, Bruce Glavovic u. a .: Chapter 4: Sea Level Rise and Implications for Low Lying Islands, Coasts and Communities . In: IPCC Special Report on the Ocean and Cryosphere in a Changing Climate . 2019, 4.1.2 Future Sea-level Rise and Implications for Responses.
- ↑ S. Jevrejeva, JC Moore, A. Grinsted: How will sea level respond to changes in natural and anthropogenic forcings by 2100? In: Geophysical Research Letters. 37, 2010, p. N / a, doi: 10.1029 / 2010GL042947 .
- ↑ Anders Levermann et al., The multimillennial sea-level commitment of global warming . In: Proceedings of the National Academy of Sciences 110, No. 34, (2013), 13745-13750, doi: 10.1073 / pnas.1219414110 .
- ↑ WMO-IWTC: Summary Statement on Tropical Cyclones and Climate Change. 2006. ( PDF; 78 kB ( Memento from March 25, 2009 in the Internet Archive ))
- ↑ Thomas R. Knutson et al. a. (2010): Tropical cyclones and climate change. In: Nature Geoscience. 3 (3), pp. 157-163 doi: 10.1038 / ngeo779
- ↑ Vladimir Petoukhov, Stefan Rahmstorf, Stefan Petri, Hans Joachim Schellnhuber: Quasiresonant amplification of planetary waves and recent Northern Hemisphere weather extremes. PNAS , 2013, doi: 10.1073 / pnas.1222000110 .
- ^ Potsdam Institute for Climate Impact Research: Press release of February 25, 2013. Accessed on March 18, 2013.
- ↑ On a collision course like a "super storm" . germanwatch.org.
- ^ World Economic Forum - Global Risks 2013 Eighth Edition .
- ↑ Jennifer Morgen in conversation with Stefan Römermann: “Every country has to do more”. In: Environment & Consumers. Deutschlandfunk.de , April 15, 2015, accessed on April 16, 2015
- ↑ Climate change - a foreign policy challenge. Auswaertiges-amt.de, December 22, 2014, accessed on April 16, 2015
- ↑ Conrad Lay: Pithy scenarios. dradio.de , November 1, 2010, accessed on November 1, 2010
- ↑ Markus C. Schulte von Drach: Climate and Peace - Climate as a question of war and peace. In: sueddeutsche.de . May 17, 2010, accessed May 26, 2015 .
- ^ Dpa: Climate change: World Security Council agrees on German climate declaration. In: zeit.de . July 21, 2011, accessed May 26, 2015 .
- ↑ Study warns of hunger and thirst: Steinmeier: Climate change endangers peace. In: wiwo.de. April 14, 2015, accessed May 26, 2015 .
- ↑ Combating climate change together. bundesregierung.de , April 15, 2015, accessed April 16, 2015
- ↑ Claudia Kemfert , Barbara Praetorius: The economic costs of climate change and climate policy. In: DIW, Quarterly Issues for Economic Research. 74, 2/2005, pp. 133-136 online
- ↑ Nick Watts et al .: The Lancet Countdown on health and climate change: from 25 years of inaction to a global transformation for public health . In: The Lancet . 2017, doi : 10.1016 / S0140-6736 (17) 32464-9 .
- ^ IPCC: Summary for Policymakers . Special report 1.5 ° C global warming . Retrieved April 20, 2019.
- ^ Stephan Lewandowsky: Future Global Change and Cognition . In: Topics in Cognitive Science . tape 8 , 2016, p. 7–18, here 11 , doi : 10.1111 / tops.12188 .
- ^ Ottmar Edenhofer, Michael Jakob: Climate Policy . CH Beck, 2017, p. 68-69 .
- ↑ Gabriel Chan, Robert Stavins, Zou Ji: International Climate Change Policy . In: Annual Review of Resource Economics . 2018, doi : 10.1146 / annurev-resource-100517-023321 .
- ^ Ottmar Edenhofer, Michael Jakob: Climate Policy . CH Beck, 2017, p. 75 .
- ↑ 196 states and the European Union, see Status of Ratification of the Convention. UNFCCC, accessed March 27, 2020 .
- ↑ a b Cf. Christiana Figueres et al: Three years to safeguard our climate . In: Nature . tape 546 , 2017, p. 593-595 , doi : 10.1038 / 546593a .
- ^ Carlo C. Jaeger, Julia Jaeger: Three views of two degrees . In: Regional Environmental Change . December 2010, doi : 10.1007 / s10113-010-0190-9 .
- ↑ United Nations Environment Program (Ed.): Emissions Gap Report 2019 . 2019, ISBN 978-92-807-3766-0 , pp. xv ( unenvironment.org ).
- ↑ UNFCCC COP13 Statement by Indigenous Peoples: Two degrees is too high. Our many strong voices must be heard ( PDF; 114 kB )
- ↑ Thorsten Hippe: The challenge of climate protection policy. Problems, solution strategies, controversies. 1st edition. Barbara Budrich Verlag, Leverkusen 2016, ISBN 978-3-8474-0537-5 .
- ^ Ottmar Edenhofer and Michael Jakob: Climate Policy - Goals, Conflicts, Solutions . CH Beck, 2017, ISBN 978-3-406-68874-4 , pp. 62-67 .
- ↑ Nicholas Stern: The Economics of Climate Change . Cambridge University Press, 2006, ISBN 978-0-521-70080-1 , pp. 349-392 .
- ^ A b Joachim Weimann: The climate policy catastrophe. Second edition. Metropolis-Verlag, Marburg 2009, ISBN 978-3-89518-729-2 .
- ^ Dieter Helm: The Carbon Crunch . First edition. Yale University Press, 2013, ISBN 978-0-300-19719-8 .
- ^ Scott Barrett: Environment & Statecraft . Oxford University Press, 2005, ISBN 978-0-19-928609-6 .
- ^ Anthony Patt: Transforming Energy. Solving Climate Change with Technology Policy . 1st edition. Cambridge University Press, 2015, ISBN 978-1-107-61497-0 .
- ↑ Erik Gawel, Sebastian Strunz, Paul Lehmann: Polito-economic limits of emissions trading. (PDF) Helmholtz Center for Environmental Research , accessed on April 18, 2016 .
- ^ Steffen Brunner, Christian Flachsland, Robert Marschinski: Credible Commitment in Carbon Policy. Institute for Climate Impact Research Potsdam, accessed on April 18, 2016 .
- ↑ Expert Council for Environmental Issues (ed.): Paths to 100% renewable electricity supply . Special report. 2011, ISBN 978-3-503-13606-3 , pp. 240 ff . ( umweltrat.de [PDF; 11.1 MB ]).
- ↑ Erik Gawel, Sebastian Strunz, Paul Lehmann: Polito-economic limits of emissions trading. (PDF) January 2013, accessed April 18, 2016 .
- ↑ Stephen Pacala, Robert Socolow: Stabilization Wedges: Solving the Climate Problem for the Next 50 Years with Current Technologies. In: Science. 305, August 14, 2004, pp. 968–972 ( PDF; 181 kB )
- ↑ Antje Boetius , Ottmar Edenhofer , Bärbel Friedrich , Gerald Haug , Frauke Kraas , Wolfgang Marquardt , Jürgen Leohold , Martin J. Lohse , Jürgen Renn , Frank Rösler , Robert Schlögl , Ferdi Schüth , Christoph M. Schmidt , Thomas Stocker 2019: Climate targets 2030 : Ways to a sustainable reduction in CO2 emissions. . Statement from the National Academy of Sciences Leopoldina , p. 12. Accessed on January 29, 2020.
- ↑ Volker Quaschning : Regenerative Energy Systems. Technology - calculation - simulation . 9th updated edition. Munich 2015, p. 56.
- ↑ IPCC 2014, quoted from: Ottmar Edenhofer, Susanne Kadner, Jan Minx: Is the two-degree target desirable and can it still be achieved? The contribution of science to a political debate. In: Jochem Marotzke, Martin Stratmann (Hrsg.): The future of the climate. New insights, new challenges. A report from the Max Planck Society. Beck, Munich 2015, ISBN 978-3-406-66968-2 , pp. 69-92, in particular pp. 77f and 83f.
- ↑ a b Kenneth Hansen et al .: Status and perspectives on 100% renewable energy systems . In: Energy . tape 175 , 2019, pp. 471-480 , doi : 10.1016 / j.energy.2019.03.092 .
- ^ Marshall Burke et al .: Large potential reduction in economic damages under UN mitigation targets . In: Nature . tape 557 , 2018, p. 549-553 , doi : 10.1038 / s41586-018-0071-9 .
- ↑ Drew Shindell , Yunha Lee, Greg Faluvégi: Climate and health impacts of US emissions reductions consistent with 2 ° C . In: Nature Climate Change . tape 6 , 2016, p. 503-507 , doi : 10.1038 / nclimate2935 .
- ^ Mark Z. Jacobson et al .: 100% Clean and Renewable Wind, Water, and Sunlight All-Sector Energy Roadmaps for 139 Countries of the World . In: Joule . tape 1 , no. 1 , 2017, p. 108-121 , doi : 10.1016 / j.joule.2017.07.005 .
- ↑ Initiate coal exit now . Expert council for environmental issues . Retrieved July 3, 2018.
- ↑ Global Energy & CO2 Status Report. The latest trends in energy and emissions in 2018 . IEA website. Retrieved April 18, 2019.
- ↑ IPCC 2018: Mitigation Pathways Compatible with 1.5 ° C in the Context of Sustainable Development, p. 95 . Special report 1.5 ° C global warming . Retrieved April 21, 2019.
- ^ New Economics Foundation: Mirage and oasis. Energy choices in an age of global warming. London 2005 ( PDF; 1.2 MB ( memento of November 2, 2012 in the Internet Archive ))
- ↑ Joachim Nitsch : "Leitstudie 2008" - Further development of the "Renewable Energies Expansion Strategy" against the background of the current climate protection goals in Germany and Europe. (PDF; 2.8 MB) ( Memento from January 12, 2012 in the Internet Archive ) (2008).
- ↑ AR4, Part III: Mitigation of Climate Change, Chap. 4. IPCC table 4.2
- ↑ Ehteshami, Chan: The role of hydrogen and fuel cells to store renewable energy in the future energy network - potentials and challenges . Energy Policy 73, (2014), 103-109, p. 103, doi: 10.1016 / j.enpol.2014.04.046 .
- ↑ Edgar G. Hertwich et al., Integrated life-cycle assessment of electricity-supply scenarios confirms global environmental benefit of low-carbon technologies . Proceedings of the National Academy of Sciences , October 6, 2014, doi: 10.1073 / pnas.1312753111
- ↑ Klaus Heuck, Klaus-Dieter Dettmann, Detlef Schulz: Electrical energy supply: generation, transmission and distribution of electrical energy for study and practice . 8th edition. Vieweg + Teubner, Wiesbaden 2010, p. 61.
- ↑ Martin Pehnt (Ed.): Energy efficiency. A teaching and manual. Berlin - Heidelberg 2010, p. 154.
- ↑ IPCC 2018: Mitigation Pathways Compatible with 1.5 ° C in the Context of Sustainable Development, p. 149 . Special report 1.5 ° C global warming . Retrieved April 20, 2019.
- ^ McKinsey & Company: Pathways to a Low-carbon Economy: Version 2 of the Global Greenhouse Gas Abatement Cost Curve. ( PDF; 6.9 MB ) (2009).
- ↑ Martin Pehnt (Ed.): Energy efficiency. A teaching and manual . Berlin Heidelberg 2010, p. 6.
- ↑ Pete Smith et al. a .: Biophysical and economic limits to negative CO2 emissions . In: Nature Climate Change . tape 6 , 2016, p. 42-50 , doi : 10.1038 / nclimate2870 .
- ↑ David P. Keller, Ellias Y. Feng & Andreas Oschlies: Potential climate engineering effectiveness and side effects during a high carbon dioxide emission scenario . In: Nature . 5, January 2014, p. 3304. doi : 10.1038 / ncomms4304 . "We find that even when applied continuously and at scales as large as currently deemed possible, all methods are, individually, either relatively ineffective with limited (<8%) warming reductions, or they have potentially severe side effects and cannot be stopped without causing rapid climate change. "
- ↑ UBA energy saving guide, individual carbon dioxide calculator, etc. online
- ↑ What reduces our personal CO2 footprint? We have no clue! November 3, 2019, accessed November 6, 2019 .
- ↑ Stephen Clune, Enda Crossin, Karli Verghese: Systematic review of greenhouse gas emissions for different fresh food categories . In: Journal of Cleaner Production . tape 140 , no. 2 , 2017, p. 766–783 , doi : 10.1016 / j.jclepro.2016.04.082 .
- ^ Tara Garnett: Cooking up a storm. Food, greenhouse gas emissions and our changing climate. Food Climate Research Network, Center for Environmental Strategy, University of Surrey, September 2008 (PDF, accessed October 7, 2012; 1.2 MB).
- ^ Matthew N. Hayek, Helen Harwatt, William J. Ripple, Nathaniel D. Mueller: The carbon opportunity cost of animal-sourced food production on land . In: Nature Sustainability . September 7, 2020, ISSN 2398-9629 , pp. 1-4. doi : 10.1038 / s41893-020-00603-4 .
- ↑ Popp, A., Lotze-Campena, H., Bodirskya, B. (2010): Food consumption, diet shifts and associated non-CO 2 greenhouse gases from agricultural production. Global Environmental Change. Vol. 20, No. 3, pp. 451-462, doi: 10.1016 / j.gloenvcha.2010.02.001 .
- ↑ From avocados to apples: Producing food locally could help reduce climate emissions. In: pik-potsdam.de . August 29, 2019, accessed October 2, 2019 .
- ↑ C. Weber, H. Scott Matthews: Food-Miles and the Relative Climate Impacts of Food Choices in the United States. In: Environmental Science & Technology. 42 (2008), pp. 3508–3513 (PDF; 854 kB)
- ^ World Bank Group Announcements at One Planet Summit. Retrieved December 13, 2017 .
- ^ Badische Zeitung: Paris summit pushes economy to climate protection - hot spots - Badische Zeitung . ( badische-zeitung.de [accessed on December 13, 2017]). Paris summit pushes business to climate protection - hot spots - Badische Zeitung ( Memento from December 13, 2017 in the Internet Archive )
- ↑ Ottmar Edenhofer , Michael Jakob. Climate policy. Goals, conflicts, solutions . Munich 2017, p. 13f.
- ^ Thomas R. Loster and Christoph Bals in E + Z / D + C: Will the trend turnaround succeed in Paris?
- ^ UNFCCC website on the Nairobi Work Program
- ^ Ian McEwan : Solar. Translated by Werner Schmitz , Diogenes Verlag , Zurich 2010, ISBN 978-3-257-06765-1
- ↑ What climate scientists think of Ian McEwan's Solar book. Climate scientist Stefan Rahmstorf reviews Ian McEwan's new climate change novel, Solar. The Guardian Environment Network, May 5, 2010 ( German version ). Retrieved March 31, 2013
- ↑ Ilja Bohnet , Ann-Monika Pleitgen : No getting through . Argument-Verlag, Hamburg 2010, ISBN 978-3-86754-183-1 .
- ↑ On Climate Change in Literature - Climate Fiction. Retrieved November 2, 2018 .
- ↑ trafo-comic.blogspot.de (March 2, 2014)
- ^ David Buckland: Climate is culture. In: Nature Climate Change 11, March 2012, ( PDF , accessed on October 12, 2013)
- ↑ David Buckland, Yasmine Ostendorf: Art attack: why getting creative about climate change makes sense. The Guardian , September 23, 2013, accessed October 12, 2013.
- ^ About - Cape Farewell - The cultural response to climate change. In: capefarewell.com. Retrieved January 18, 2017 .
- ^ Jason Horowitz: Italy's Students Will Get a Lesson in Climate Change. Many Lessons, in Fact. In: New York Times . November 6, 2019, accessed November 6, 2019 .
- ↑ In the source "33-hour-a-year" is given, which corresponds to 44 school hours of 45 minutes. After deducting the school holidays, this results in around 1 school hour per week.