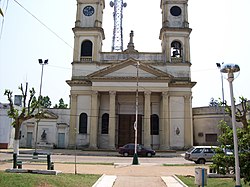
Paso de los Libres
Paso de los Libres | |
|---|---|
 San José Church, Paso de los Libres | |
| Country | Argentina |
| Province | Corrientes |
| Department | Paso de los Libres |
| Government | |
| • Mayor | Eduardo A. Vischi (Unión Cívica Radical) |
| Population | |
| • Total | 43,805 |
| Demonym | libreño/a |
| Time zone | UTC-3 (ART) |
| CPA base | W3320 |
| Dialing code | +54 3772 |
Paso de los Libres is a city in the east of the province of Corrientes in the Argentine Mesopotamia. It has about 44,000 inhabitants as of the 2001 census [INDEC], and is the head town of the department of the same name.

The city lies on the right-hand (western) shore of the Uruguay River, opposite the city of Uruguaiana, Rio Grande do Sul, Brazil, to which it is joined by a road and railway bridge (Paso de los Libres-Uruguaiana International Bridge). The area is served by Paso de los Libres Airport.
Climate
| Climate data for Paso de los Libres | |||||||||||||
|---|---|---|---|---|---|---|---|---|---|---|---|---|---|
| Month | Jan | Feb | Mar | Apr | May | Jun | Jul | Aug | Sep | Oct | Nov | Dec | Year |
| Mean daily maximum °C (°F) | 33.0 (91.4) |
31.0 (87.8) |
29.5 (85.1) |
25.4 (77.7) |
22.1 (71.8) |
18.5 (65.3) |
19.1 (66.4) |
21.4 (70.5) |
22.0 (71.6) |
26.3 (79.3) |
28.8 (83.8) |
31.7 (89.1) |
25.7 (78.3) |
| Daily mean °C (°F) | 26.5 (79.7) |
25.1 (77.2) |
23.3 (73.9) |
19.8 (67.6) |
16.2 (61.2) |
13.1 (55.6) |
13.4 (56.1) |
15.4 (59.7) |
16.2 (61.2) |
20.1 (68.2) |
22.8 (73.0) |
25.2 (77.4) |
19.8 (67.6) |
| Mean daily minimum °C (°F) | 20.6 (69.1) |
20.2 (68.4) |
18.1 (64.6) |
15.2 (59.4) |
11.5 (52.7) |
8.8 (47.8) |
9.3 (48.7) |
10.4 (50.7) |
11.3 (52.3) |
14.2 (57.6) |
17.4 (63.3) |
18.7 (65.7) |
14.6 (58.4) |
| Average precipitation mm (inches) | 124.0 (4.88) |
163.9 (6.45) |
176.2 (6.94) |
214.7 (8.45) |
152.5 (6.00) |
100.4 (3.95) |
82.9 (3.26) |
70.2 (2.76) |
144.0 (5.67) |
120.6 (4.75) |
174.2 (6.86) |
87.7 (3.45) |
1,611.3 (63.42) |
| Average precipitation days | 8 | 9 | 8 | 8 | 7 | 8 | 7 | 7 | 8 | 8 | 8 | 6 | 92 |
| Average relative humidity (%) | 66 | 74 | 75 | 80 | 81 | 83 | 81 | 77 | 76 | 70 | 70 | 63 | 75 |
| Source: Servicio Meteorologico Nacional[1] | |||||||||||||
References
- ^ "Datos Estadísticos (Período 1981-1990)" (in Spanish). National Meteorological Service of Argentina. Retrieved August 23, 2012.
- Municipal information: Municipal Affairs Federal Institute (IFAM), Municipal Affairs Secretariat, Ministry of Interior, Argentina. (in Spanish)
