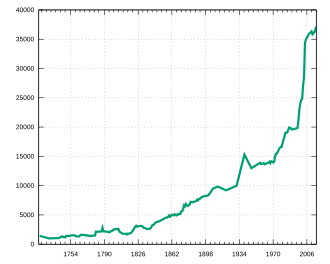
Population development of Bernau near Berlin
This article shows the population development of Bernau near Berlin for the territorial status of the respective year in a table.
On December 31, 2019, the official population of Bernau was 40,031 according to the Berlin-Brandenburg Statistics Office (only main residences and after comparison with the other state statistical offices ).
The population of Bernau has increased steadily. This can be explained on the one hand by the well-developed infrastructure (transport links to the capital by S-Bahn , regional express and regional train , developed road system and motorway ), on the other hand by the incorporation of today's districts, which alone led to an increase of around 9,000 inhabitants.
Incorporations
The following places were incorporated into the city of Bernau:
- Birkholz on December 6, 1993
- Ladeburg on July 1, 2001
- Börnicke on December 31, 2002
- Lobetal on December 31, 2002
- Schönow on October 26, 2003
At the last time they were recorded before their incorporation, they had the following population figures:
- Birkholz 427 inhabitants (December 31, 1992)
- Ladeburg 2025 inhabitants (December 31, 2000)
- Börnicke 433 inhabitants (December 31, 2001)
- Lobetal 707 inhabitants (December 31, 2001)
- Schönow 5371 inhabitants (December 31, 2002)
Population 1816 to 2000
|
|
|
|
Footnotes: ¹: December 1st, ²: December 2nd, ³: December 3rd, ⁴: October 8th, ⁵: June 16th, ⁶: May 17th, ⁷: October 29th, ⁸: August 31st
Until 1858 it is an estimate, then census results or official updates from the respective statistical offices. Unless otherwise stated, the reference date is December 31st.
Population as of 2001
|
|
Column 2: Population update by the Berlin-Brandenburg Statistics Office, as of December 31, 2011 based on the 2011 census
Column 3: Number of inhabitants (main residence) according to the registration office data of the Bernau city administration, as of December 31
Individual evidence
- ↑ Population development and areas of independent cities, districts and municipalities in the State of Brandenburg 2016 , p. 9
- ↑ Historical municipality register of the state of Brandenburg 1875 to 2005. District Barnim . Pp. 14-17
- ^ Population in the state of Brandenburg from 1991 to 2015 according to independent cities, districts and municipalities . Table 7
- ^ Office for Statistics Berlin-Brandenburg (Ed.): Statistical report AI 7, A II 3, A III 3. Population development and population status in the state of Brandenburg (respective editions of the month of December)
- ↑ Selected statistical information from the city of Bernau near Berlin for 2018 , p. 4

