Gross-net scissors
In media studies in particular, the gross-net gap denotes the difference between formally reported and actually negotiated advertising prices.
Pure gross income, such as that published by Nielsen Media Research annually for the advertising market, can present a distorted picture of the advertising market. Only a comparison with the net income, as presented by the Central Association of the German Advertising Industry (ZAW), allows conclusions to be drawn about the discounts granted by the providers or the expenses actually received by them.
The prices shown by advertising providers generally represent the maximum possible income on the market, which is then adjusted downwards to the customers' ability and willingness to pay. The price actually paid by the customer, i.e. the gross price less discounts granted, agency costs and intermediary fees, represents the net price.
Especially when the advertising market is in a crisis, the gross-net gap threatens to widen further, since the providers of advertising space want to acquire new customers through discounts.
An example in which the difference between net and gross sales is very high is the television market. Here, net advertising income only accounts for half of the gross. This means that the broadcasters themselves only receive around 50% of the income they are actually targeting. The following table can illustrate the development of the gross-net gap using data from the television sector:
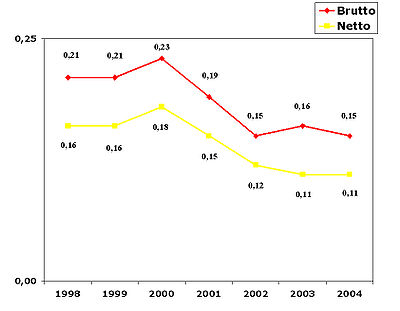
For example, if you transfer the values from RTL and ZDF into a diagram, it becomes clear that the gap between the net and gross prices at RTL has increased over time. The gross-net gap is therefore wider:

|
| RTL gross and net advertising expenses |
A slightly different picture can be seen at the ZDF station. The difference between gross and net was subject to the usual market fluctuations, but a general trend cannot be discerned here. The private broadcasters like RTL are much more dependent on the placement of advertising as the sole source of income and are therefore more interested in giving their customers price discounts:

|
| ZDF gross and net advertising expenditure |
Individual evidence
- ↑ Michael Heffler, Pamela Möbius: Der Werbemarkt 2004 , in: Media Perspektiven, No. 6, 2005, pp. 258–266 ( page no longer available , search in web archives ) Info: The link was automatically marked as defective. Please check the link according to the instructions and then remove this notice. (PDF; 313 kB)
- ↑ The gross advertising revenues are based on data from Nielsen Media Research, while the net figures come from the ZAW. An exact breakdown of the net advertising revenues is no longer possible for the later years, as the ZAW has summarized the revenues of the private broadcasters since 2005. These and the data of other broadcasters can be viewed on the website of the commission for determining the concentration in the media sector (PDF; 69 kB)