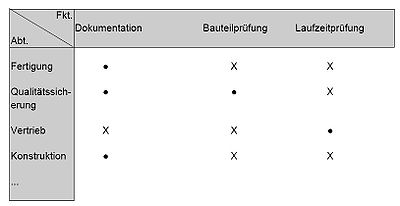
Matrix diagram
A matrix diagram is a graphic representation of correlations and can be viewed as an influencing matrix . Text, symbols and pure graphs can be used for representation. The portfolio analysis, which is used for data acquisition or processing, is directly related to the matrix diagram .
The matrix diagram (see matrix and diagram ) is one of the seven management tools . It belongs to the sub-category of finding a solution and, in terms of use, is more in management than in construction . In the matrix diagram, relationships between two factors are indicated by symbols which can symbolize various names. The matrix diagram can also be used to evaluate a solution or weighting.
Like most of the tools, the matrix diagram is used to clearly show the interactions between problems or functions, so that more complex relationships can also be shown. A partial solution or evaluation can then be developed with these representations.
A matrix diagram is implemented in the form of a table. A distinction is made between the following versions:
- The L-shape - 2 axes, most common application (analog: Zwickie morphology )
- The T-shape - 3 axes
- The Y shape - 3 axes (cube shape)
- The X-shape - 4 axes (analog: morphological box )
