Maximum intensity projection

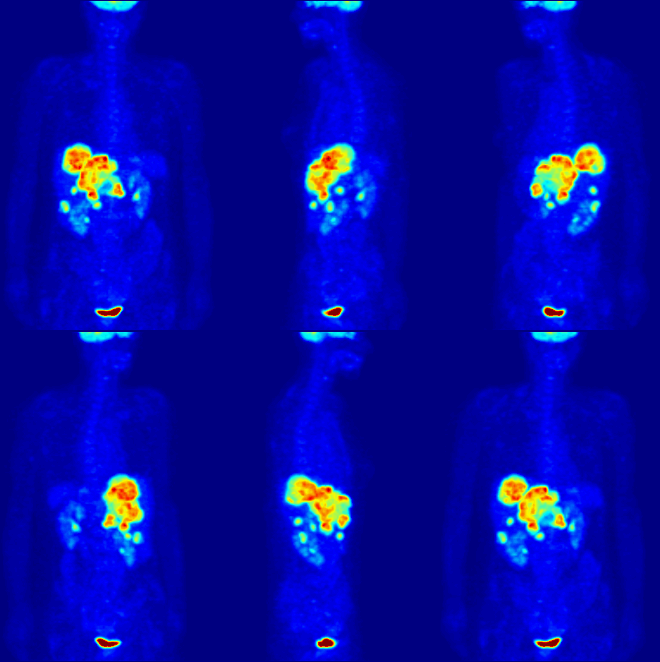
The maximum intensity projection ( MIP , engl. Maximum intensity projection ) is a procedure of the image processing , which is primarily in the medical diagnosis is applied. The maximum intensity projection converts three-dimensional image data sets into two-dimensional projection images by selecting the data point with the maximum intensity along the viewing direction (projection direction). An important area of application of maximum intensity projections is the display of CT angiography and magnetic resonance angiography data; In these data, the blood vessels generally have high signal intensities and are therefore clearly visible through the maximum intensity projection. Further applications are the display of nuclear medicine PET or SPECT data.
Maximum intensity projections are often used to display three-dimensional data sets as rotating animation , as in the example images on the left . For this purpose, the MIPs are calculated from many different angles and displayed one after the other.
The maximum intensity projection often results in a semi-transparent image impression, as in the adjacent image examples. Due to the lack of perspective, it is not possible to distinguish whether structures are in the front (close to the viewer) or behind in the object. As a result, when viewing animated MIPs, the impression may arise that the direction of rotation is changing.
Working principle
The principle of maximum intensity projection can most easily be illustrated in a two-dimensional example, from which one-dimensional projections are to be calculated. A 3 × 3 matrix is used here as an example data set; First the maximum intensity projection in the horizontal projection direction is calculated:
The maximum value (marked in red) is taken from each row of the matrix. The maximum intensity projection thus differs from a normal projection image, as it occurs, for example, in conventional x-ray , in that the maximum is formed instead of the mean value over all values in the projection direction.
The calculation of the maximum intensity projection in the vertical direction is carried out in the same way:
By interpolating the data, it is also possible to calculate in any other projection directions.
designation
Instead of the term maximum intensity projection , the English term maximum intensity projection is often used untranslated in German-language texts . Occasionally one also finds the term maximum intensity projection .
variants
Often the projection through the entire 3D data set is not calculated, but only through a disk-shaped partial volume (sub-volume), which can consist of a certain number of successive layers, for example. This sub-volume maximum intensity projection is also known as Thin-slab MIP or, for short, ThinMIP , since it is calculated from a thin slab and not from the (thicker) total data set. In order to map the entire data set in this way, the total volume can be subdivided into numerous (parallel) partial volumes, from each of which a sub-volume MIP is calculated; this technique is referred to as sliding subvolume MIP (engl. sliding thin-slab MIP ) designated.
In the minimum intensity projection ( MinIP , engl. Minimum intensity projection ) instead of the maximum intensities of the respective minimum intensities are selected in the viewing direction. This method is used, for example, to display MR angiography data in which the vessels appear dark instead of light due to the technology used, such as in susceptibility-weighted images of the cerebral veins (MR venography ). The minimum intensity projection is almost always calculated as a sub-volume MinIP.
In computed tomography , the minimum intensity projection is used to visualize the lungs and especially the low-signal bronchi.
literature
- Mathias Goyen (Ed.): MR angiography with Vasovist . ABW Wissenschaftsverlag, Berlin 2007, ISBN 978-3-936072-52-5 , p. 27-29 . ( limited preview in Google Book search)
- Harald H. Quick: Magnetic resonance angiography: Basics and practice for radiographers . ABW Wissenschaftsverlag, Berlin 2007, ISBN 978-3-936072-46-4 , p. 70-71 . ( limited preview in Google Book search)
Individual evidence
- ^ RR Edelman, KU Wentz, H. Mattle, B. Zhao, C. Liu, D. Kim, G. Laub: Projection arteriography and venography: initial clinical results with MR . In: Radiology . tape 172 , no. 2 , 1989, pp. 351-357 , PMID 2748814 .
- ↑ S. Naples, GD Rubin, RB Jeffrey Jr .: STS-MIP: a new reconstruction technique for CT of the chest . In: Journal of Computer Assisted Tomography . tape 17 , no. 5 , 1993, p. 832-838 , PMID 8370848 .
- ^ JR Reichenbach, M. Essig, EM Haacke, BC Lee, C. Przetak, WA Kaiser, LR Schad: High-resolution venography of the brain using magnetic resonance imaging . In: MAGMA Magnetic Resonance Materials in Biology, Physics, and Medicine . tape 6 , no. 1 , 1998, p. 62-69 , doi : 10.1016 / S1352-8661 (98) 00011-8 , PMID 9794291 .
- ↑ M. Bhalla, DP Naidich, G. McGuinness, JF Gruden, BS Leitman, DI McCauley: Diffuse lung disease: assessment with helical CT - preliminary observations of the role of maximum and minimum intensity projection images . In: Radiology . tape 200 , no. 2 , 1996, p. 341-347 , PMID 8685323 .


