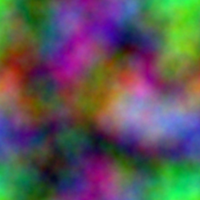
1 / f² noise
1 / f² noise (also known as "Brownian", "Brown" or "red noise") denotes noise in which the power density is inversely proportional to the square of the frequency (~ 1 / f²). The noise power density decreases by a factor of four or 6 dB when the frequency doubles ( octave ) or by 20 dB per decade. The similar 1 / f noise , on the other hand, shows a decrease in the noise power density of 3 dB per octave or 10 dB per decade.
The names Brown and Brownian for 1 / f² noise relate to the Scottish botanist and namesake of the Brownian motion , Robert Brown , not "brown" in color ( english brown ). For example, Brownian motion corresponds to 1 / f² noise. Nevertheless, since other types of noise are also referred to with colors (“ white noise ” or 1 / f noise as “ pink noise ”), the term brown noise is also common.
Power density spectrum
The Brownian molecular motion can be described as a stochastic process in the context of the Wiener process as the integral of white noise :
White noise has a constant power density:
with the Fourier transform . One property of the Fourier transform is that the derivative that occurs can be expressed as a product as:
with as the imaginary unit and the angular frequency .
This results in the absolute power density spectrum for 1 / f² noise from the constant absolute power density spectrum for white noise as:
1 / f² noise can clearly be generated by filtering white noise with a second-order low-pass filter with a cut-off frequency of 0 Hz.
1 / f² noise can also be made audible, but the frequency component is limited to low-frequency signal components due to the sharp drop in the power density spectrum of 20 dB per decade, so that infrasound occurs primarily not or only with difficulty for humans .
Visualization
1 / f² noise can be visualized by inverse Fourier transforming a discrete two-dimensional complex function with a bi- hyperbolically decreasing amplitude and a random phase . The amount of the complex-valued inverse Fourier transform can be output both in one color (gray levels) and separately for the three color channels as an RGB signal .
1 / f² noise can theoretically be made audible by inversely Fourier transforming a discrete one-dimensional complex function with a bi- hyperbolically decreasing amplitude and a random phase . However, the frequency component is limited to very low-frequency signals so that the infrasound cannot be heard by humans.
| 1 / f² noise | |
|---|---|
|
Two-dimensional, colored noise signals |

|
|
Two-dimensional, gray-scale noise signals |

|
Color analogy of the name
The term red noise was formed with a comparable color analogy to the terms white noise and pink noise . Since the lower frequencies dominate even more strongly in the power density spectrum of red noise than with pink noise, the resulting color impression - in the figurative sense - corresponds to something that is redder than pink.
literature
- Rudolf Müller: Noise . 1st edition. Springer, 1979, ISBN 3-540-09379-6 .
- Michael Dickreiter, Volker Dittel, Wolfgang Hoeg, Martin Wöhr: Handbuch der Tonstudiotechnik, 2 volumes . Ed .: ARD.ZDF medienakademie. 7th edition. Saur, Munich 2008, ISBN 978-3-598-11765-7 .
- Thomas Görne: Sound engineering . Fachbuchverlag Leipzig in Carl Hanser Verlag, Munich 2006, ISBN 3-446-40198-9 .
Web links
Individual evidence
- ^ JA Barnes, DW Allan: A statistical model of flicker noise . In: Proceedings of the IEEE . 54, No. 2, 1966, pp. 176-178. and the references listed therein


![S_ {0} = \ left | {\ mathcal {F}} \ left [{\ frac {dW (t)} {dt}} \ right] (\ omega) \ right | ^ {2} = {\ text { constant}}](https://wikimedia.org/api/rest_v1/media/math/render/svg/5f7c13e804516f2d2aa145a73139427271dac5a3)

![{\ mathcal {F}} \ left [{\ frac {dW (t)} {dt}} \ right] (\ omega) = {\ mathrm {j}} \ omega {\ mathcal {F}} [W ( t)] (\ omega)](https://wikimedia.org/api/rest_v1/media/math/render/svg/dd7aaea243e79b6327a11ee93eb1a2e3b8d568f7)


![S (\ omega) = \ left | {\ mathcal {F}} [W (t)] (\ omega) \ right | ^ {2} = {\ frac {S_ {0}} {\ omega ^ {2} }}](https://wikimedia.org/api/rest_v1/media/math/render/svg/01fa7f9e43d13b92e3963ab57c2c070d243f4b0d)