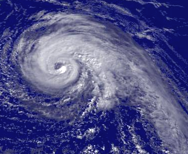
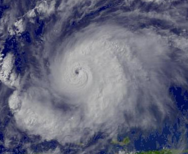
Dvorak technique
The Dvorak technique (developed in 1974 by Vernon Dvorak) is a common system for subjectively determining the intensity of tropical cyclones using satellite images and infrared images .
Technical details
| T number | Wind speed | minimum central pressure (hPa) | ||
|---|---|---|---|---|
| ( Knot ) | (km / h) | Atlantic | NW Pacific | |
| 1.0 - 1.5 | 25th | 46 | ---- | ---- |
| 2.0 | 30th | 56 | 1009 | 1000 |
| 2.5 | 35 | 65 | 1005 | 997 |
| 3.0 | 45 | 83 | 1000 | 991 |
| 3.5 | 55 | 102 | 994 | 984 |
| 4.0 | 65 | 120 | 987 | 976 |
| 4.5 | 77 | 143 | 979 | 966 |
| 5.0 | 90 | 167 | 970 | 954 |
| 5.5 | 102 | 189 | 960 | 941 |
| 6.0 | 115 | 213 | 948 | 927 |
| 6.5 | 127 | 235 | 935 | 914 |
| 7.0 | 140 | 260 | 921 | 898 |
| 7.5 | 155 | 287 | 906 | 879 |
| 8.0 | 170 | 315 | 890 | 858 |
| Note: The central pressures in the NW Pacific are set lower because the air pressure in the Pacific is generally lower than in the Atlantic. | ||||
The Dvorak technique exploits the fact that developing cyclones of the same intensity mostly have similar properties, and that the appearance of these cyclones usually changes characteristically with increasing intensity. The structure of a tropical cyclone is analyzed every 24 hours in order to identify whether the cyclone has intensified, weakened or maintained its intensity. Several templates of typical storm structures are available with which the core and rain band structure of the storm can be compared in order to be able to draw conclusions about the intensity. If an eye can be made out on infrared images of the storm , the intensity can also be deduced from the temperature differences of the warm eye and the surrounding cloud structure. ( 'Where the warmer the eye and the colder the cloud peaks of the eyewall are, the stronger the hurricane.) Upon completion of the analysis for each system a so-called T-number and a CI number ( Current Intensity , "current intensity" ). The T numbers range from 1 (lowest intensity) to 8 (highest intensity). In most storms, T-numbers are identical to CI-numbers, except in rapidly weakening systems where the CI-number is higher than the T-number.
Structure types
A distinction is made between different structures that can be observed during a storm and that allow an upper and lower limit of intensity.
- curved rain band structure (T1.0 – T4.5)
- Shear structure (T1.5 – T3.5)
- Central Dense Overcast (CDO) (T2.5 – T5.0)
- Initial eye stage (T4.0 – T4.5)
- Eye structure (T4.5 – T8.0)
If the structure has been recognized, a T number can then be deduced by analyzing the features found (e.g. length and curvature of the rain bands).
use
The Dvorak technique is mostly only used in the Atlantic with stronger systems for comparison with other observations (reconnaissance flights, QuikSCAT data as well as ship and buoy observations ). Only for storms in the East Atlantic, where reconnaissance flights would be too expensive due to the great distance to the base, the Dvorak technology is used specifically to determine the storm intensity. However, the Dvorak technique is the most important basis for determining the storm intensity for storms in all other development areas. (Reconnaissance flights are only carried out in the Atlantic and the East Pacific )

|

|

|

|
| Tropical storm Wilma as T3.0 | Tropical Storm Dennis as T4.0 | Hurricane Jeanne as T5.0 | Hurricane Emily as T6.0 |
See also
Other means of determining the intensity of a tropical cyclone:
- QuikSCAT - NASA scatterometer
- TRMM - Precipitation Measurement Satellite
Other satellite-based intensity measurements:
- Extra Tropical Conversion Technique - for storms that transform into an extra tropical storm
- Hebert-Poteat technology - for subtropical storms
Web links
Individual evidence
- ^ Satellite and Information Service Division: Dvorak Current Intensity Chart . National Oceanic and Atmospheric Administration . April 17, 2005. Retrieved June 12, 2006.
- ^ "Tropical Cyclone Forecasters Reference Guide" . Naval Research Laboratory. Retrieved May 29, 2006.
- ↑ NOAA HRD FAQ . NOAA . Retrieved December 21, 2010.
- ^ The Dvorak Technique Explained . NOAA . Retrieved May 29, 2006.
- ↑ De Maria, Mark: "Satellite Application is Tropical Weather Forecasting . Archived from the original on August 13, 2006. Info: The archive link has been inserted automatically and has not yet been checked. Please check the original and archive link according to the instructions and then remove this notice. Accessed on May 29, 2006.