Economic Value Added
The Economic Value Added (EVA) or economic value added (EVA) is a key figure from the financial sector that serves the profitability of an investment to be assessed. EVA represents a residual profit and gives an absolute net profit after deducting the cost of capital for the total capital employed. Simplified: EVA = capital income minus capital costs. The Du Pont scheme aims in a similar direction , but it is based on the ROI .
calculation
The calculation is presented in two (mathematically identical) equations:
- NOPAT = net operating profit after taxes
- WACC = weighted average cost of capital (weighted average of debt and equity costs)
- NOA = net operating assets (invested capital or operating assets)
- ROCE = NOPAT / NOA = return on capital employed (return on investment)
- GOP = Gross Operating Profit
Formula (1) is known as the capital charge formula . As a value-spread formula is called the formula (2). The advantage of (2) is the more visible relationship between return on investment, cost of capital and increase in value. Once the return on investment ( ROCE ) exceeds the cost of capital ( WACC ), an investment creates value.
development
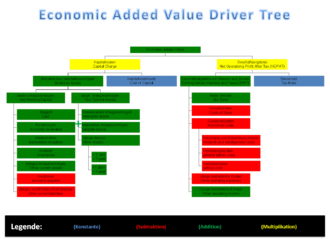
The EVA was developed by the management consultancy Stern Stewart & Co , which has secured the trademark rights to the acronym EVA . The translation into German, GWB , is protected by Siemens AG . According to a study by KPMG , twelve of the 30 DAX companies used the EVA as a control parameter in 2000 . The key figure is intended to facilitate the analysis and evaluation of companies, parts of companies or projects and also serve as a basis for incentive control (see performance-based remuneration ). A more recent development in value-based performance measurement is the indexed operational performance measurement, which breaks down value contributions into the components of the value driver tree on the basis of economic value added. The indexed operational performance measurement also enables the cycle-independent measurement of the performance and the standardized comparison of the key figures.
Transformations
Like others, Stern Stewart & Co have recognized the problem of accounting-based data. Due to existing accounting options, the available data cannot be compared across companies and is therefore less informative for shareholders . Therefore numerous suggestions are made for the conversion of the numbers. According to Stern Stewart & Co, the total number of possible transformations is 164, but according to critics, this also serves marketing purposes in part. In addition, the adjustments are often too complex to make economic sense. In practice, individual adjustments are therefore made, usually three to five. The adjustments are usually divided into four categories:
- Operating Conversions : Here, the result of the operational activity should be presented as clearly as possible and the assets not required for the business should be left aside.
- Funding conversions : Here the financing is adjusted, e.g. B. also hidden financing such as leasing or rent. Furthermore, non-interest-bearing liabilities are eliminated.
- Shareholder conversions : Here, the non-recorded equity figures are taken into account (such as original goodwill or intangible assets), but debts and assets are also adjusted to market values.
- Tax Conversion : Here, the tax burden is adjusted in order to achieve a fiction of equity financing.
criticism
The advantage of the EVA is that it is easy to understand and communicate, as it is based on the accounting figures .
The EVA can be easily manipulated using the NOPAT variables and the capitalized capital. Depreciation leads to distortions, because if investments are not made, the fixed assets decrease and the EVA increases over time without creating any added value. This means that the incentives are set incorrectly and the willingness of management to invest can be inhibited. This is particularly the case if performance-related salary components are paid due to EVA.
In addition, this surplus is one-period and is based on balance sheet data based on the past. This disqualifies them as a measure of performance for a future-oriented company analysis, since future potential and cash flow developments are not taken into account. The EVA is therefore only suitable to a limited extent for a company valuation or project valuation.
Criticism is often linked to conversions . The desired comparability is again reduced by the large selection options. The different origins of the data also met with criticism.
In the more recent literature, a simplified calculation of the economic value added is recommended, which takes into account the communicability of the key figure and can be used more easily in value-based bonus systems (see performance-based remuneration ).
See also
literature
- Joel M. Stern, John S. Shiely: The EVA challenge: implementing value-added change in an organization . John Wiley & Sons, New York 2001, ISBN 0-471-40555-8 .
- G. Bennet Stewart: The quest for value: the EVA management guide . HarperBusiness, New York 1991, ISBN 0-88730-418-4 .
- Jürgen Weber, Utz Schäffer: Introduction to controlling . Schäffer-Poeschel, 2011, ISBN 3-7910-1504-4 .
Individual evidence
- ^ A b c Stephen F. O'Byrne: EVA and Value Based Management . MacGraw-Hill, 2000.
- ↑ Hermann J. Stern : Market-oriented Value Management: Achieve competitive advantages through the Finance Intelligence Radar . Wiley, 2007, ISBN 978-3-527-50258-5 .
- ↑ a b Stephan Hostettler / Hermann J. Stern : The Value Cockpit . Wiley, 2004, ISBN 3-527-50102-9 .


