Isotonic regression

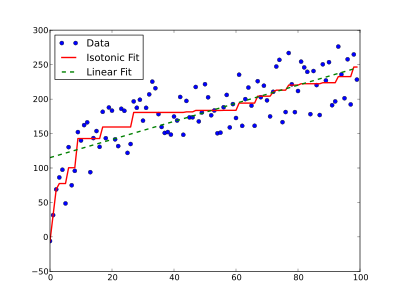
The isotonic regression is a regression method , with an isotonic (order-preserving) mapping between a dependent and an independent variable is found. If monotonic maps , i.e. isotonic and antitonic maps, are considered, the procedure is called monotonic regression . The curve described by the figure, unlike, for example, linear regression, does not have a fixed form, but only the restriction of being monotonically increasing (or decreasing) while the distance to the data points is as small as possible.
application
If a monotonic relationship is expected between a parameter and measured values of an experiment, this can be determined by monotonic regression, even if the measured values are falsified by noise. A model assumption such as linearity does not have to be made.
In the area of machine learning, there are often models that output a probability for a classification of data points. Depending on the type of model, the predicted probabilities may be skewed compared to the frequency of the classes in the data. The predictions can be calibrated for correction. A suitable method for this is based on isotonic regression.
algorithm
In isotonic regression, values are adapted to observations with associated weights using the least squares method , whereby constraints of the shape (mostly ) must be observed. That is, each point must have a value at least as high as the previous point.
The conditions describe a partial or total order , which can be defined as a directed graph , denoting the set of observations and the set of pairs for which applies. With this, the isotonic regression can be formulated as the following quadratic program :
When there is total order, the problem can be solved in.
Individual evidence
- ^ Probability calibration. In: scikit-learn documentation. Retrieved November 21, 2019 .
- ↑ Michael J. Best, Nilotpal Chakravarti: Active set algorithms for isotonic regression; A unifying framework . In: Mathematical Programming . tape 47 , no. 1-3 , 1990, pp. 425-439 , doi : 10.1007 / BF01580873 .


