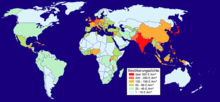
Cartogram
Kartograms are thematic maps in which quantitative statements are presented on fixed reference areas. The respective information applies to the entire area, without considering internal variations. Often, statistical information that was collected at one level of the administrative structure is presented as a cartogram.
Representation variants of the cartogram
- Area map, choropleth map
- Relative values (or qualitative classifications with a clear ranking) are represented by area fills according to a scale, mostly using colors or hatching.
- Area drawing or body drawing cartogram
- A scalable geometric signature shows the value for each reference area. Area symbols are e.g. B. squares, circles. Body symbols are two-dimensional physical elements (e.g. cuboids, drawn in perspective).
- Map diagram, diakartogram
- For each reference unit, values and developments are shown in a diagram. The basic structure and the scale of the diagram are the same for all territorial units.
- Point cartogram
- In contrast to the area drawing cartogram, here one point stands for a defined set. The number of points in the reference area gives the total amount (absolute). The points are not in the correct position, but rather arranged geometrically.
- Field map
- Here the reference area is not based on political or geographical orders, but the entire map area is subdivided into the same geometric fields. These are filled with color or hatching according to the measured values determined.
- Stripe card chart
- A hybrid form of area map and map diagram. The surface color is divided into several stripes, which in their respective widths reflect the proportion of certain qualities within the reference surface.
- Tape cartogram
- A special form of the cartogram. Here, the displayed quantity does not relate to an area, but to a simplified line object (e.g. a traffic route).
Absolute and relative values
Absolute values are shown in diagrams. Relative values are implemented as area-filling colors or hatching. The facts presented should actually have a surface reference z. B. Population per square kilometer .
Differentiation from the English term cartogram
The English word cartogram has a different meaning. It stands for an anamorphic map (a representation that is not to scale). See also: isodemographic map
