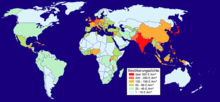
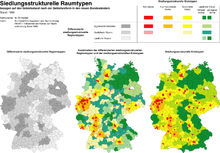
Choropleth map


A choropleth map ( ancient Gr . Χῶρος choros 'place' and πλῆθος plethos 'multitude'), also area map or area value level map , is a thematic map in which the areas are colored, shaded, dotted or hatched in relation to the distribution density of the thematic object. The areas of uniformly assigned identical values are sharply delimited from one another. Choropleth maps usually use a map base of equal area. You convey z. B. a picture of the areas affected by population decline, high rental prices or unemployment.
This is used to represent area-related ordinal or graduated quantitative data. The factual data presented by the areas do not relate to a single location, but more or less broad areas such as B. States , federal states , municipalities , electoral districts or other statistical spatial reference units.
The choropleth representation can produce errors if the reference surfaces are incorrectly chosen because of the mostly rigid division into fixed sub-units. This concerns, for example, sharp fluctuations in the distribution density that do not coincide with the specified limits. Asymmetrical mapping can compensate for this disadvantage by adapting its sub-units to the available data and by combining areas with similar properties.
Real and fake surfaces
With the choropleth map, a distinction is made between real and fake areas. In real areas, the property shown by the map actually applies everywhere in this area. This can e.g. B. be a currency that represents the valid currency everywhere within this area. The property that represents a fake surface, however, does not apply everywhere in the surface. As an example, one can look at the religious affiliation in states: If you create a map for an area that shows the religion that is most represented in this area, this applies to most of the residents, but not to all.
Individual evidence
- ↑ Markus Burgdorf, Jessica Huter: An alternative method for representing regional structures using the example of unemployment. In: Statistical monthly books Lower Saxony. Issue 12, 2009, p. 611.
- ↑ Jürgen Bollmann, Wolf Günther Koch: Lexicon of cartography and geomatics. Volume?, Year, p. 118.
- ↑ Municipal spatial reference system
- ^ Adrian Herzog, Claudia Hofstetter: Structural Atlas of the Canton of Zurich. Methodology. (PDF; 1.3 MB) p. 7 , accessed on May 3, 2019 .
- ↑ Gerold Olbrich, Michael Quick, Jürgen Schweikart: Desktop Mapping Basics and Practice in Cartography and GIS. Springer, 2002, ISBN 3-540-64890-9 , p. 38.