
Nuclear weapons effect

The nuclear weapon effect is the influence of above-ground tests with nuclear weapons after 1945 on the isotopic composition of the earth's atmosphere.
The tests of the hydrogen bombs from 1953 onwards in particular temporarily doubled the proportion of radioactive carbon isotope 14 C in the atmosphere and increased it in the long term. The treaty between the USA, Great Britain and the Soviet Union on a comprehensive ban on atmospheric nuclear weapons tests ended this phenomenon of the 14 C increase in the atmosphere in 1963 .
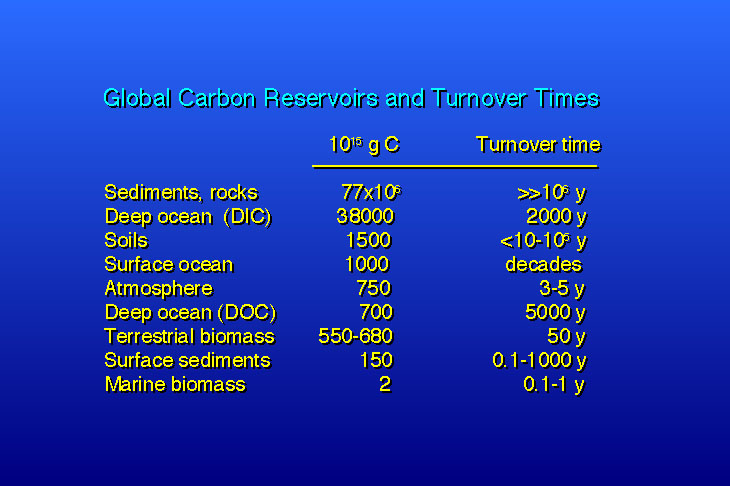
The 14 C / 12 C ratio in the atmosphere has been falling again since the aboveground nuclear weapons tests were banned . This degradation of the 14 C concentration takes place faster than it corresponds to the normal radioactive decay of this isotope. The earth's atmosphere contains 3,000 gigatons of CO 2 , which are completely exchanged every 3–5 years on average, which means that the amount introduced by the nuclear weapons tests was very quickly diluted and its concentration quickly fell. The rapid decline in the 14 C / 12 C ratio allows for a better time resolution in the 14 C dating of samples from the time after the atmospheric nuclear weapons tests than before.
A small part of the decrease in concentration can also be attributed to the sweet effect , which comes about because the burning of fossil fuels also introduces a steady stream of 14 C-depleted carbon dioxide into the atmosphere . In 2012, 35.6 gigatons of carbon dioxide were released through the burning of fossil fuels and cement production.
The 14 C measurements show seasonal fluctuations in the years after 1963. This can be explained by the increased seasonal exchange between troposphere and stratosphere . The 14 C concentration in the southern hemisphere did not reach its maximum until 1965, as most of the nuclear weapons tests took place in the northern hemisphere. However, the 14 C values in the northern and southern hemispheres had adjusted within a few years. This confirms an earlier research result by EC Anderson on the spatial homogeneity of 14 C in the atmosphere. This uniform distribution is an important requirement for the calibration and application of the radiocarbon method .
See also
- Age determination
- Dendrochronology
- Treaty banning nuclear weapons tests in the atmosphere, in space and underwater
swell
-
↑ Data from Trends: A Compendium of Data on Global Change. Carbon Dioxide Information Analysis Center , Oak Ridge National Laboratory, US Department of Energy, Oak Ridge, Tenn., USA:
- Manning, MR, and WH Melhuish: Atmospheric δ 14 C record from Wellington , 1994. ( English )
- Levin, I., B. Kromer, H. Schoch-Fischer, M. Bruns, M. Münnich, D. Berdau, JC Vogel, and KO Münnich: δ 14 CO 2 record from Vermunt , 1994. ( English )
- ↑ Mass of atmospheric carbon dioxide IGSS, Institute for green and sustainable Science
- ↑ Global Turnover times and reservoires Department of Earth System Science, University of California
- ↑ For example: EM Wild et al .: 14 C dating with the bomb peak: An application to forensic medicine , Nuclear Instruments and Methods in Physics Research Section B, Volume 172, Issues 1-4, October 2000, Pages 944-950, doi : 10.1016 / S0168-583X (00) 00227-5 ( English )
- ↑ Corinne Le Quéré , Glen Peters et al .: Global carbon budget 2012 (PDF; 2.6 MB) In: global carbon project . Tyndall Center for Climate Change Research . December 2, 2012. Archived from the original on September 27, 2013. Info: The archive link was automatically inserted and not yet checked. Please check the original and archive link according to the instructions and then remove this notice. Retrieved April 7, 2013.
- ↑ Anderson, EC, WF Libby ,.: Worldwide distribution of natural radiocarbon. Physical Review, 1951, 8164-69 ( English )