Matplotlib
| Matplotlib
|
|
|---|---|
 A compilation of finished graphs and the associated program code. |
|
| Basic data
|
|
| developer | John D. Hunter |
| Publishing year | 2003 |
| Current version |
3.3.0 ( July 16, 2020 ) |
| operating system | platform independent |
| programming language | python |
| category | Program library |
| License | Matplotlib license |
| www.matplotlib.org | |
Matplotlib is a program library for the Python programming language , which allows you to create all kinds of mathematical representations.
description
Matplotlib can be used with Python 2.x and 3.x and works on all common operating systems . A Python-like object-oriented interface is used for this. After importing the library, graphs can be created using the Python console. However, you can also integrate Matplotlib into existing Python programs. Matplotlib uses connections to GUI libraries such as GTK + , Qt , wxWidgets and Tk for this purpose . The graphics can be created in a variety of formats, such as: E.g .: SVG , PNG , Anti-Grain Geometry , EPS , PDF .
Matplotlib pledged to support Python 2 only until 2020 and was added to the list of the Python 3 declaration on May 20, 2016.
development
The first version of matplotlib was developed by John D. Hunter in 2002 and 2003. Right from the start it was intended as a free open source library. Today the development on GitHub is driven by many people.
Examples
Curves
>>> import matplotlib.pyplot as plt
>>> import numpy as np
>>> a = np.linspace(0,10,100)
>>> b = np.exp(-a)
>>> plt.plot(a,b)
>>> plt.show()
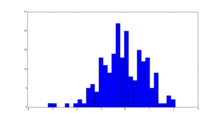
histogram
>>> import matplotlib.pyplot as plt
>>> from numpy.random import normal,rand
>>> x = normal(size=200)
>>> plt.hist(x,bins=30)
>>> plt.show()
Scatter plot
>>> import matplotlib.pyplot as plt
>>> from numpy.random import rand
>>> a = rand(100)
>>> b = rand(100)
>>> plt.scatter(a,b)
>>> plt.show()
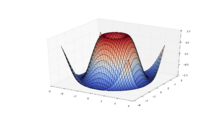
3D plot
>>> from matplotlib import cm
>>> from mpl_toolkits.mplot3d import Axes3D
>>> import matplotlib.pyplot as plt
>>> import numpy as np
>>> fig = plt.figure()
>>> ax = fig.gca(projection='3d')
>>> X = np.arange(-5, 5, 0.25)
>>> Y = np.arange(-5, 5, 0.25)
>>> X, Y = np.meshgrid(X, Y)
>>> R = np.sqrt(X**2 + Y**2)
>>> Z = np.sin(R)
>>> surf = ax.plot_surface(X, Y, Z, rstride=1, cstride=1, cmap=cm.coolwarm)
>>> plt.show()
Further examples
Web links
- Official website
- Matplotlib's Github page
- Matplotlib: Lessons from middle age - Video in which John D. Hunter describes the development of the project
- Matplotlib instructions
Individual evidence
- ↑ matplotlib.org .
- ↑ Release 3.3.0 . July 16, 2020 (accessed July 17, 2020).
- ↑ Add matplotlib to list by takluyver · Pull Request # 20 · python3statement / python3statement.github.io ( English ) Accessed July 7, 2018.
- ↑ Moving to require Python 3 , from python3statement.org, accessed October 17, 2018
- ^ John D. Hunter: Matplotlib: A 2D Graphics Environment . In: Computing in Science & Engineering . 9, No. 3, September, pp. 90-95. doi : 10.1109 / MCSE.2007.55 .
- ^ Matplotlib credits . Matplotlib. Retrieved August 7, 2014.


