Operational contribution
The operational contribution or operational value contribution (OVC - operating value contribution) is an evaluation method within the framework of the concept of indexed operational performance measurement . The operational contribution summarizes the operational ranks of several companies or several key figures over several time periods in an evaluation method. In the indexed operational performance measurement, the operational contribution is used to make the value contributions of several business areas or several key figures universally comparable over time and to measure them independently of external effects.
Examples
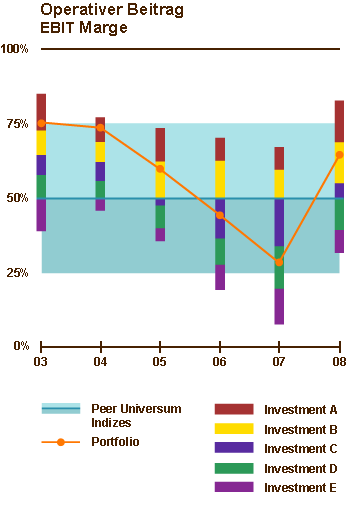
The first figure shows the operational contribution of a key figure of several companies. The operational contribution is calculated by subtracting 50 ranks from the operational rank . The operating contribution is then plotted up and down based on the median line ( operating index ). In other words, the operational contribution shows the outperformance of the operational rank compared to the median. The operational amounts of the key figure for several companies (or business areas or investments) are shown in the graphic below as colored bars for several years. In addition to the median (operating index) of the comparable companies as a blue line, the first and third quartile limits (limits of the blue shading) are also entered in the graph . In the blue areas there are therefore 50% of all comparison rsp. Peer company. The orange dots that are connected with an orange line represent the sum of the operating contributions of all companies.
The second figure shows the operational contribution of a company or a portfolio (averages of the contributions in the portfolio) for several key figures. The operational contributions of the key figures are shown as colored bars for several years. In addition to the median (operating index) of the comparable companies as a blue line, the first and third quartile limits (limits of the blue shading) are also entered in the graph . The orange dots connected with an orange line represent the sum of the operational contributions of all key figures.
See also
Individual evidence
- ^ Hermann J. Stern : Benchmarking in the supervisory board for corporate management . In: Journal for Corporate Governance ZCG. December 2007 Article as PDF ( Memento of the original from August 28, 2008 in the Internet Archive ) Info: The archive link was inserted automatically and has not yet been checked. Please check the original and archive link according to the instructions and then remove this notice.

