X-ray emission spectroscopy
The X-ray emission spectroscopy (to English: X -Ray E mission S pectroscopy: XES ) is a röntgenspektroskopisches measuring method in which the light emitted from a material (emitted) X-ray spectrum is recorded.
One distinguishes between:
- Non-resonant X-ray emission spectroscopy (XES)
- -Measurements
- Valence-to-Core (VtC / V2C) measurements
- ( ) Measurements
- Resonant X-ray Spectroscopy (RXES or RIXS)
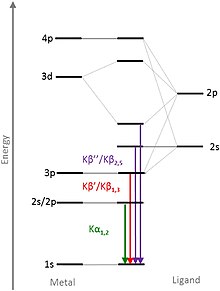
Electrons or X-ray photons of sufficient energy are usually used for excitation , but there are also X-ray sources that generate their characteristic X-ray radiation by decelerating protons and / or ions . During a measurement, only a certain energy range is usually selected according to the electron transitions to be observed. Transitions that correspond to the energies of the valence electrons (valence to core, VtC / V2C for short) are particularly meaningful. When the line is measured, these transitions can be found as a small hill on slightly higher energies than the main peak (Fig. 1). For this reason, the K lines are also the most frequently examined emission lines. The exact electron transitions can be seen in Figure 2.
history
As the forefather of this process the British physicist applies Henry Moseley , the relationship between the wavelength - line in X-rays and atomic number ( Moseley's law discovered). Later it turned out that the characteristic energies of the emission lines of the elements can be used as direct fingerprints for the elemental analysis.
Since X-rays in most media have a refractive index of n ≈ 1 , special optics are required to diffract X-rays according to their energies or wavelengths. William Lawrence Bragg developed the Bragg equation for this . This describes the patterns that arise during the diffraction of neutrons and X-rays when they pass through a crystal lattice ( X-ray diffraction ).
The formula he established ,, states that an X-ray quantum with a certain energy bends at a precisely defined angle within a crystal.
(Further) development
Usually emission measurements with X-rays are / were only carried out on the beam paths of synchrotrons. These offer many advantages, but the "beam time" for scientists is usually very short, which is why independent devices with a lower resolution than that of a synchrotron are becoming more and more popular. The scientists can use this to examine the chemical environment of their samples before a “beam time”. Many full protection devices today are based on the principle of the Rowland Circle (Fig. 3). This describes a circle on which, at certain angles, all the photons of an energy emitted by a sample can be focused in one point.
The X-ray emission spectrum is characteristic of the respective excited element, and in the soft X-ray range one can recognize the dependence on the chemical environment of the element from the fine structure. If X-ray photons are used for excitation, resonant effects can become evident in the X -ray emission spectra , when excited close to X -ray absorption edges , which are known as resonant inelastic X -ray scattering (RIXS). In contrast to the electron-excited X-ray emission spectra, strong excitation-energy-dependent structures can occur.
As an analytical method, X-ray emission spectroscopy has some advantages over electron spectroscopy:
- great depth of information, since the interaction of photons with matter is far less than that of electrons; so-called buried layers can be probed, and the use of thin X-ray windows allows measurements on gases and liquids.
- high selectivity of the information in the spectra with regard to orbital and spin symmetry, as well as the chemical environment.
- the resonant inelastic X-ray scattering does not suffer any broadening due to the lifetime of the trunk level excitation.
Individual evidence
- ↑ S. DeBeer: Advanced X-Ray Spectroscopy . (PDF) June 2016, accessed on July 22, 2019.
- ↑ a b Jeroen A. van Bokhoven, Carlo Lamberti: X-Ray Absorption and X-Ray Emission Spectroscopy Theory and Applications . John Wiley & Sons, 2016, ISBN 978-1-118-84423-6 , pp. 125 ( limited preview in Google Book Search).
- ↑ J. Kowalska, S. DeBeer: The role of X-ray spectroscopy in understanding the geometric and electronic structure of nitrogenase . In: Biochimica et Biophysica Acta (BBA) - Molecular Cell Research , Vol. 1853 Issue 6, June 2015, accessed on July 22, 2019.
- ^ R. Vanselow, Russell Howe: Chemistry and Physics of Solid Surfaces IV . Springer Science & Business Media, 2013, ISBN 978-3-642-47495-8 , pp. 22 ( limited preview in Google Book search).


