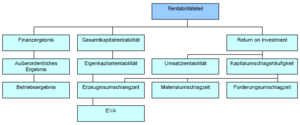
RL key figure system
The RL key figure system was developed by Thomas Reichmann and Laurenz Lachnit in 1976 and represents a profitability - liquidity - key figure system. In contrast to other key figure systems, this key figure system thus contains two top key figures, which have an equal position and thus the target pluralism within one Corporate account.
construction
The RL key figure system is purely a classification system which - compared to the DuPont key figure system and ZVEI key figure system - contains relatively few key figures. The aim is to depict factual, logical relationships.
At the top of the system of indicators are the indicators liquidity and profitability . There is no mathematical breakdown of these two variables.
The key figure system is divided into two areas:
- the general area
- the special area
General area
This area contains the key figures for success and liquidity related to the entire company:
- The “decent result” is shown as the top key figure using profitability. Other - logically related - key figures are
- The “liquid funds” are represented with the key figure liquidity. Sub-key figures include a.
Special area
This area is also divided into liquidity and profitability, but company-specific key figures are taken into account, such as B.
- Contribution margins
- Fixed costs
purpose
The RL key figure system serves primarily as a planning and control instrument. The general area is used for ongoing control, management and planning thanks to its key figures. The special area provides information on key factors influencing profitability and liquidity.
literature
- T. Czenskowsky, G. Schünemann, N. Zdrowomyslaw: Basics of controlling . Gernsbach 2004, ISBN 3-88640-107-3 .
- L. Lachnit: Balance sheet analysis . Wiesbaden 2004, ISBN 3-409-12695-3 .


