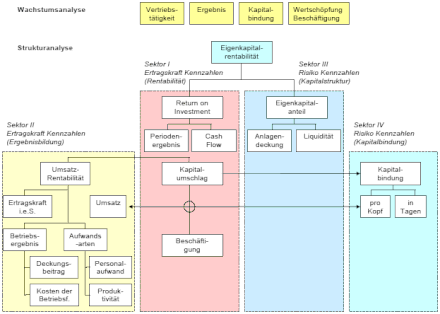
ZVEI key figure system
The ZVEI key figure system is an industry-neutral key figure system developed by the Central Association of the Electrical Engineering and Electronics Industry . It is an instrument for the analytical business assessment, for determining the efficiency of a company ( controlling ) and thus an information system for the purpose of corporate management. The ZVEI key figure system was developed in 1989 (1970) on the basis of the Du Pont scheme and contains 88 main and 122 auxiliary key figures. Although the key figure system was developed by an industrial association , it is used with great success by companies from a wide variety of industries and is the most widespread of all the key figure systems used in Germany.
function
The most important sources of information of the key figure system are the balance sheet and the profit and loss account . The ZVEI key figure system uses two levels of analysis , growth and structure analysis. It tracks both liquidity and profitability and can be seen as an evolution of the DuPont metrics system. In contrast to the DuPont key figure system, the ZVEI key figure system does not focus on the return on total capital but on the return on equity .
Growth analysis
Before the actual analysis (structural analysis) begins, the growth analysis gives an approximate overview of the operational events, the previous development and the future expectations (business volume, personnel , success). It consists of the analysis groups: sales , results , capital commitment , value creation , employment . The growth analysis shows the development compared to the previous periods using absolute figures.
Structural analysis
The structural analysis is based on the key figure of return on equity and considers the company's efficiency differentiated by profitability , result formation, capital structure and capital formation by means of the balance sheet figures or the profitability and risk figures. The structure analysis is structured similarly to the DuPont key figure system. The return on equity is explained by ROI and equity ratio.
Four (ratio) key figures are obtained from the absolute figures ( stock figures , movement figures), the period-related earnings power (earnings power figure) and the time-related risks (risk figure):
- Earning power indicator type A: movement size / movement size (e.g. return on sales = profit / turnover); Analysis of the formation of results
- Earning power indicator type B: movement size / stock size (e.g. ROI = profit / capital); Analysis of the company's profitability
- Risk indicator type A: portfolio size / portfolio size (e.g. equity share = equity / total capital); Analysis of the capital structure
- Risk indicator type B: stock size / movement size (e.g. sufficient stock = capital commitment / time); Analysis of the capital commitment
The confusion of the key figures has a disadvantageous effect on the ZVEI key figure system.
See also
literature
- ZVEI, Business Management Committee: ZVEI key figure system: an instrument for corporate management , 4th edition, Sachon, Frankfurt am Main 1989, ISBN 3-920819-77-2
- W. Gladen: KPIs and reporting systems , Gabler textbook, Wiesbaden 2003, ISBN 3-409-21828-9
- F. Witt: Controlling Lexikon , DTV-Beck, 2002, ISBN 3-406-46843-8
- J. Steger: Key figures and key figure systems , NWB, 2014, ISBN 978-3-482-65031-4
