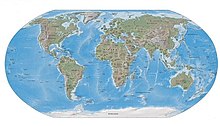
Robinson projection

The Robinson projection is a map network design that was developed in 1961 by the American cartographer Arthur H. Robinson .
The Robinson projection is a mediating figure . It does not represent a projection in the strict sense and it is not based on a closed mathematical formula like other map network designs (e.g. Mercator projection ), but on a table of reference points that were determined empirically. All points between these reference points are determined by interpolation.
The advantage of Robinson projection is that it looks very natural. Only in the area of the poles does it show relatively large deviations in angle and area, which increase with the distance from the central meridian. However, it is not free of distortion in any area.
history
The Robinson projection goes back to a request from the US map publisher Rand McNally , who approached Robinson in 1961 to select a projection that, among other conditions, should be uninterrupted, as low-distortion as possible and "eye-friendly" for the viewer. Robinson could not find a known projection that met these criteria, so Rand McNally commissioned him to develop one.
Robinson projection has been used in maps by Rand McNally since the 1960s. The National Geographic Society used them for their world maps from 1988 to 1998, but has been using the Winkel-Tripel projection instead since 1998 .
description
The Robinson projection is not described by a geometric projection or a closed formula, but by specifying fixed values for the lengths and distances of the circles of latitude from 0 ° to 90 ° in steps of 5 °. Circles of latitude are represented as straight lines that are parallel to the equator. The poles are also straight lines, their length is 0.5322 times the length of the equator. The central meridian, which is the only meridian to be mapped on a straight line, has 0.5072 times the equator length from pole to pole. Points between the specified points are interpolated using different interpolation methods.
The following table shows the lengths and distances of the parallels. The length is related to the equatorial length, the distance to the distance of the pole line from the equator. To give this distance on the same scale as the length of the parallels, it must be multiplied by half the length of the central meridian (0.2536).
| Latitude | Length of parallel | Distance from the equator |
|---|---|---|
| 00 | 1.0000 | 0.0000 |
| 05 | 0.9986 | 0.0620 |
| 10 | 0.9954 | 0.1240 |
| 15th | 0.9900 | 0.1860 |
| 20th | 0.9822 | 0.2480 |
| 25th | 0.9730 | 0.3100 |
| 30th | 0.9600 | 0.3720 |
| 35 | 0.9427 | 0.4340 |
| 40 | 0.9216 | 0.4958 |
| 45 | 0.8962 | 0.5571 |
| 50 | 0.8679 | 0.6176 |
| 55 | 0.8350 | 0.6769 |
| 60 | 0.7986 | 0.7346 |
| 65 | 0.7597 | 0.7903 |
| 70 | 0.7186 | 0.8435 |
| 75 | 0.6732 | 0.8936 |
| 80 | 0.6213 | 0.9394 |
| 85 | 0.5722 | 0.9761 |
| 90 | 0.5322 | 1.0000 |
Individual evidence
- ↑ Ningchuan Xiao: GIS Algorithms. Sage, Los Angeles / London / New Delhi / Singapore / Washington DC 2016, ISBN 978-1-4462-7432-3 , pp. 33–45.
