
Map network design

A map network design (also called map projection or map mapping ) is a method in cartography with which the curved surface of the (three-dimensional) earth is transferred onto the flat (two-dimensional) map .
Action
The process of modeling takes place with the help of mapping rules that can be expressed mathematically. Map projections can also be explained graphically or geometrically.
In the modern development towards spatial data infrastructure (technology and terminology), map network designs form a special type of coordinate reference system and represent a method of converting a mathematical earth model into the plane. Over 400 different images are known.
When using draft map networks, three steps are necessary:
- Selection of a suitable model (usually one chooses between a sphere and an ellipsoid ) for the shape of the earth or the object to be depicted (e.g. other planetary bodies)
- Conversion of the geographic coordinates (longitude and latitude) into a Cartesian coordinate system (x and y or easting and northing)
- Scaling the map (in manual cartography this step came second, in digital cartography it can come last)
Categories
Basically one classifies map network designs either according to
- the imaging surface
- the position of the imaging surface
- the imaging properties (distortion properties)
- real or fake (pseudo) images.
Many network designs were named after their inventors (see list of map network designs )
Classification according to image areas
Selection of the image area
Most map network designs are not physically projections . They are more based on mathematical formulas. However, in order to understand the concept of map projection, it is helpful to imagine a globe with a light source. This light source projects the points, lines and surfaces of the globe onto an auxiliary surface that can easily be rolled into the plane.
Either a plane , a cone , a cylinder or another surface can be used as an auxiliary surface. By projecting the globe elements onto this auxiliary surface, a flat image is obtained. However, you have to roll the cone and cylinder surface into the plane beforehand. In principle, one can differentiate between all map projections according to the type of auxiliary area used.
Finally, it is important whether the auxiliary surface touches or intersects the globe as a model. In the case of a cylindrical image (in its normal position) the image surface touches the globe around the equator (there are no distortions at this point), whereas a sectional cylinder cuts the globe at the northern and southern parallels . The principle applies to all illustration auxiliary surfaces.
| Auxiliary surface | Projection name | example |
|---|---|---|
| level | azimuthal mapping azimuthal projection |

|
| cone | conical figure cone projection |

|
| cylinder | cylindrical figure cylindrical projection |

|
Azimuthal images
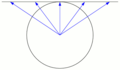
In an azimuthal imaging, the image plane touches the earth at one point. Many azimuthal images are real perspective projections ( central projections ), which means that they can also be constructed geometrically.

Stereographic projection
Gnomonic projection
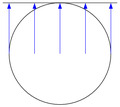
Orthographic projection (infinitely distant central point)


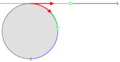
The true view of the globe (or any other celestial body) is not suitable for cartography, not only is it not true to length, angle or area, it also shows only a limited section of a hemisphere (half the surface). A geostationary satellite, for example, has a coverage area of theoretical maximum only 42% of the earth's surface from above the pole from one would not see the equator. The following geometric projections with a projection center are common to remedy this problem:
- Orthographic azimuthal projection , also commonly known as " parallel projection", in which the projection beams are parallel. The projection center is, so to speak, at infinity. It is used for the clear representation of the globe, as well as for the representation of other celestial bodies (moon, planets).
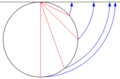
- Stereographic projection (conformal azimuthal projection) in which the projection center is opposite the point of contact. She will u. A. used for star maps because of their angular accuracy.
- Gnomonic projection , also called "central projection " ("central" here refers to the center of the earth ), in which the projection center is in the center of the earth . It depicts all great circles as straight lines. This is why it is often used in navigation to find the shortest connection between two points.
Azimuthal Equidistant Projection
Lambertian azimuthal projection


Further figures are defined purely mathematically. As a rule, they cannot be constructed geometrically with a compass and ruler. But they have special properties that cannot be achieved by the geometric projections. The main uses are:
- Azimuthal equidistant projection (equidistant azimuthal projection), in which the distances from the map center are reproduced without distortion. She is z. B. used by radio services: The antenna is at the point of contact, and you can easily determine the direction and the distance to your radio partner.
- Azimuthal equal-area projection according to JH Lambert. She will u. a. used in atlas maps.
All mathematical constructions that are similar to real azimuthal projection are summarized under fake azimuthal mapping .
Cone images (conical images)
With conical images (cone projections) , the earth is mapped onto a cone. The cone axis runs through the center of the earth. The position of the two intersection or the contact circle determines the shape and position of the cone. Azimuthal and cylindrical maps are borderline cases of the general cone map. The following applies to cones in normal position:
- Opening angle → 180 °: azimuthal imaging
- Opening angle → 0 °: cylindrical image
- Equal length cone projection
- Lambert's conformal cone projection
- Albers cone projection (true to area)
False cone images are also conoidal constructions, such as the heart shape ( Bonnesche projection , Stab-Werner projection ).
Cylinder images
Cylinder projections are constructed around the earth using a cylinder.
- Longitudinal cylinder projection, rectangular flat map ( rectangular projection ), and especially the square flat map (geographic projection)
- Mercator projection
- Equal area cylinder projection or (Gall) Peters projection
- Miller cylinder projection
- Lambert's equal-area cylinder projection
In the Gauß-Krüger and UTM coordinate systems , transverse cylinder projections (horizontal cylinder axis) are used.
Fake cylinder images are mathematically constructed images in which the central meridian and all circles of latitude are straight or at least straight lines.
Classification according to position or aspect of the image surface
After the choice of the auxiliary surface has been determined, its location must now be decided. The earth axis and the mass line of the auxiliary body are used for the description. With a plane this is the vertical, with a cylinder the center line and with a cone the center line through the apex. The different imaging surfaces can be placed anywhere on the surface of the sphere. The choice of the position (= aspect of the image area) is determined by the part of the earth's surface to be imaged, for which the image is to be optimized:
- normal pictures
- transverse images
- oblique images.
| Location / aspect | description | example |
|---|---|---|
| normal or polar | The axis of the auxiliary surface corresponds to the earth's axis |
|
| transverse or transverse axis, equatorial | The axis of the auxiliary surface is perpendicular to the earth's axis |

|
| obliquely or obliquely | The axis of the auxiliary surface is oblique to the earth's axis |

|
Classification according to imaging properties (distortion properties)
A card should reproduce the original as precisely as possible. When the sphere is mapped onto the plane, however, distortions are inevitable. (Mathematically: The Gaussian curvature is an invariant among isometries ; the spherical surface with radius r has the curvature 1 / r, the plane, however, the curvature 0, consequently there can be no isometry between the spherical surface and the plane.) This phenomenon can be visualized with help imagine an orange: Even if you manage to peel it in one piece, you can only get the peel (earth's surface) flat with strong pressure (paper) and accept distortions (the peel stretches, tears or folds) . This phenomenon of distortion can be justified using differential geometry. The Tissot indicatrix (distortion ellipse) is used to describe the local distortion properties at a point .
Thus, the length of a route, the size and shape of an area or the angle between two lines can change through the map projection. As a result, the scale on a map can also vary. A popular example is the almost huge representation of Greenland in the Mercator projection. These distortions can never be completely eliminated. All map projections contain at least one form of these distortions, which is why you have to decide on certain advantages and disadvantages among these mapping properties:
- Longitudinal (equidistant) mapping - some lines are mapped correctly (e.g. for distance measurements)
- Area-true (equivalent) mapping - all areas are correctly mapped according to the scale
- conformal (conformal) image (for example, for navigation or for Geodesy )
- Mediating distortion properties - compromises between length, area and angle accuracy.
The length accuracy can only be achieved to a limited extent with flat maps: in certain directions or at certain points. All real images are true to length at the contact or intersection circles. Absolute length accuracy in all points and in all directions is not possible. In the case of conformal images, the length distortion at a certain point is the same in each direction ( azimuth ).
The globe offers the possibility of reproducing all metric properties almost correctly on a certain scale. Due to the very small scale , a sphere is sufficient as an approximation for the earth figure - a slightly flattened ellipsoid of revolution.
True-to-length illustrations
These images are not absolutely true to length, but only permit true length measurements along lines other than the contact or intersection circles.
- Square flat map and rectangular flat map (spaced cylinder images) - along the meridians
- Azimuthal equidistant projection - from the center point or along the radii
- Azimuthal orthographic projection - along the circles around the point of contact
- Equal length cone projection
- Sinusoidal projection - along the parallels and the central meridian
- Werner Cordiform
Equal area maps
These images correctly represent the size of an area (e.g. a continent). However, the shape can be very distorted. These images tend to have strong shape distortions, especially at the edge of the map.
- Peters projection (cylinder projection, also called Gall-Peters projection or Gall projection)
- Projection according to Walter Behrmann
- Albers cone projection
- Azimuthal equal-area projection according to JH Lambert
- Mollweide projection by Carl Brandan Mollweide
- Hammer Aitov projection
- Briesemeister projection
- Sinusoidal projection
- Eckert II , IV and VI projection
- Goode projection (cut cards)
Conformal illustrations
True-to-angle images are required in particular for navigation in shipping and air traffic to create maps, but also in crystallography .
Mediating illustrations
Since no map image completely eliminates all distortions, some intermediary images were developed as a compromise. Attempts have been made to minimize distortion with them.
- Kawraiski VII projection by Vladimir Kawraiski
- Eckert-I- , -III- and -V-projection (equidistant parallels)
- Robinson projection
- Van der Grinten projection
- Miller cylinder projection
- Angle-triple projection
- Wagner IX projection (also called Aitov Wagner projection)
False images (pseudo-images)
In the normal position, the longitudes remain straight lines in real images , the latitudes are shown as right-angled concentric circles, arcs or straight lines. All other images fall into the group of fake or Pseudo-images .
False azimuthal images
- Aitov projection 1889
- Hammer planisphere (true to area)
Fake cone figures
- Bonnean projection , fake cone image (heart shape)
- Stab-Werner projection , fake cone image (heart shape)
Fake cylinder pictures
In contrast to the real cylinder images, the meridian images are (mostly) (p) curved lines.

- Globular projections : This includes all early ancient and premodern map designs that still lack a sound mathematical knowledge of projection geometry. All of them are empirical auxiliary networks based on well-formed simple curves in a circle.
- Sinusoidal projection
- Mollweide projection by Carl Brandan Mollweide
- Eckert projections (I – VI) by Max Eckert-Greifendorff
- Robinson projection
- Goode projection (cut card)
Ragged nets
- Goode projection (cut card)
- Dymaxion projection by Buckminster Fuller
- Waterman world map
- Cahill Keyes World Map
Illustrations in practice
- Swiss national coordinates
- Gauss-Krüger coordinate system for Germany and Austria
- UTM coordinate system - Universal Transversal Mercator Projection (global zone system)
See also
literature
- Eugen Kuntz: Map network design theory . Herbert Wichmann Verlag, Karlsruhe 1983
- Karlheinz Wagner: Cartographic network designs . Bibliographisches Institut Mannheim, 2nd edition 1962
- Annoni et al .: Map Projections For Europe . European Commission (EUR 20120) (PDF file; ~ 5 MB)
Web links
- Map network drafts (Böhm hiking maps)
- Map network designs (page by M. Panitzki)
- Map projections of Europe (MapRef.org) (English / partly German content)
- Map Projection Overview , very comprehensive
- Mathematical Cartography
- Hans Havlicek's Picture Gallery of Map Projections
- different projections in the Panotools wiki
- Cartographical Map Projections (Engl.)
- Gallery of Map Projections
- Compare map network designs
Individual evidence
- ↑ http://www.progonos.com/furuti/MapProj/Dither/ProjMAz/projMAz.html#Wagner9
- ↑ http://www.quadibloc.com/maps/mmi0902.htm
-
^ Rolf Böhm: map projections - globular projections , on boehmwanderkarten.de;
Carlos Alberto Furuti: Map Projection: Premodern Projections: Globular Projections , on progonos.com.