Value chain diagram
The value chain diagram ( WKD ) is a model for the representation of business processes in an organization in business process modeling / representation of the process organization (process architecture) in company mapping . It is mainly used at a high level of abstraction.
Elements of the value chain diagram
Value chain
A value chain in the value chain diagram has the same characteristics as a function in the event-driven process chain .
Relationships
The following relationships between value chains are available:
|
|
||||
| to display a hierarchical structure is process-oriented overriding |
to represent a sequence is the predecessor of |
The relationships between value chains are also referred to as structure-building relationships because they describe either the functional structure (relationship: is process-oriented, superordinate ) or the process structure (relationship: is the predecessor of ) an organization.
Other elements and relationships
In addition, it is possible
- Organizational units / departments ,
- Data objects and
- But also application systems
- Services ,
- Goals ,
- Measurands and
- Representing risks and their relationships to value chains.
The relationships between value chains and other elements are also referred to as non-structure-forming relationships because they describe neither the functional structure nor the process structure of an organization.
Outline of business processes
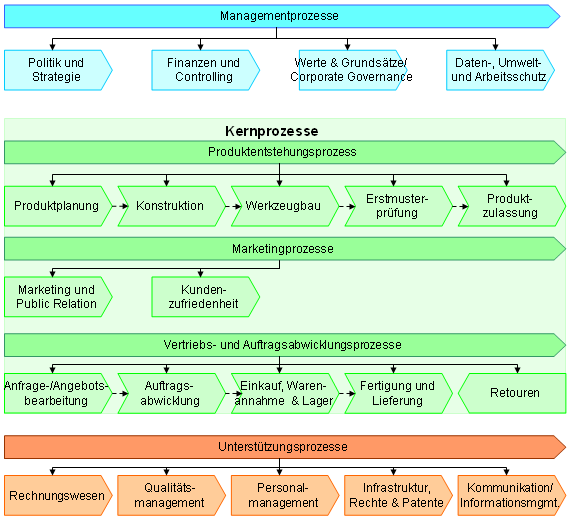
When displaying business processes in value chain diagrams, these are broken down into sub-processes that are related to one another.
|
Maintaining clarity
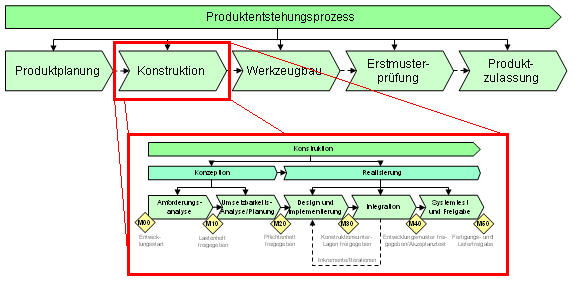
In order to structure the business processes and sub-processes in value chain diagrams clearly and without overloading the presentation, several value chain diagrams can be nested / cascaded hierarchically.
|
Inclusion of additional information in value chain diagrams
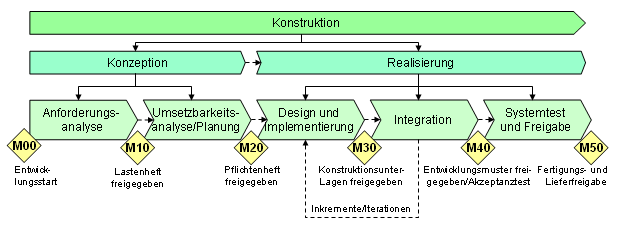
Milestones are used to clearly delimit sub-processes or phases of a business process.
|
If further elements and relationships are used in the value chain diagram, a representation like the following could result:
|
Advantages and disadvantages of the value chain diagram
+ Value chain diagrams can represent business processes in a very simple and intuitive way (see Figures 2 and 4).
+ At the same time, they enable the representation of hierarchical relationships and a linking according to the sequence.
- However, if the number of sub-processes shown and, above all, the number of their relationships to one another or to organizational units, data objects, application systems, services, goals, measured variables or risks increases, value chain diagrams quickly become confusing (see Figure 5).
- Rules according to which process paths are divided cannot be adequately represented in value chain diagrams.
- In order to reduce the number of relationships and thus the complexity, the use of function assignment diagrams (FZDs) is recommended in connection with value chain diagrams.
- In order to show rules according to which process paths are divided, the event-driven process chain (EPC), the process chain diagram (VKD) or swimlane diagrams (as in Business Process Modeling Notation ) can be used instead of the value chain diagram . However, the simultaneous display of hierarchical relationships must be avoided.
See also
- Function assignment diagram (FZD)
- Event-driven process chain (EPK)
- Process chain diagram (VKD)
- Function tree (FB)
- Swimlane diagrams (e.g .: Business Process Modeling Notation )


