Military production during World War II

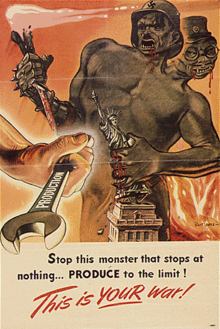
Military production during World War II was a critical component to military performance during the war. Over the course of the war the Allied countries outproduced the Axis countries in most categories of weapons.
GDP - Gross domestic product

This table shows the relationships in GDP (Gross domestic product) between a selection of Allied and Axis countries, from 1938 to 1945, counted in billion international dollars and 1990 prices.
| Country | 1938 | 1939 | 1940 | 1941 | 1942 | 1943 | 1944 | 1945 |
|---|---|---|---|---|---|---|---|---|
| Austria | 24 | 27 | 27 | 29 | 27 | 28 | 29 | 12 |
| France[1] | 186 | 199 | 164 | 130 | 116 | 110 | 93 | 101 |
| Germany | 351 | 384 | 387 | 412 | 417 | 426 | 437 | 310 |
| Italy[2] | 141 | 151 | 147 | 144 | 145 | 137 | 117 | 92 |
| Japan[3] | 169 | 184 | 192 | 196 | 197 | 194 | 189 | 144 |
| Soviet Union[4] | 359 | 366 | 417 | 359 | 274 | 305 | 362 | 343 |
| UK | 284 | 287 | 316 | 344 | 353 | 361 | 346 | 331 |
| USA[5] | 800 | 869 | 943 | 1 094 | 1 235 | 1 399 | 1 499 | 1 474 |
| Allied Total:[6] | 1 629 | 1 600 | 1 331 | 1 596 | 1 862 | 2 065 | 2 363 | 2 341 |
| Axis Total:[7] | 685 | 746 | 845 | 911 | 902 | 895 | 826 | 466 |
| Allied/Axis GDP:[8] | 2.38 | 2.15 | 1.58 | 1.75 | 2.06 | 2.31 | 2.86 | 5.02 |
Notes on the table (remember that the distribution values are rough estimates):
- ^ France-Axis distribution: 1940: 56%, 1941-43: 100%, 1944: 58%.
- ^ Italy distribution: 1938-1943: 100% Axis, 1944-1945: 100% Allies
- ^ Japanese values are included in Axis totals for all years in order to illustrate potential contribution
- ^ Soviet Union-Allies distribution: 1939: Only 67% due to the pact with Germany, but none to Axis. During 1940 Soviet Union is not counted at all. 1941: 44% is distributed to the Allies (after Operation Barbarossa), 1942-1945: 100%.
- ^ US values are included in Allied totals for all years in order to illustrate potential contribution & Lend-Lease
- ^ The Allied total is not the immediate sum of the table values; see the distribution rules used above.
- ^ The Axis total is not the immediate sum of the table values; see the distribution rules used above.
- ^ Allied/Axis GDP: This row shows the relation in GDP between the Allies and the Axis; i.e. 2.00 means the Allied production was 2 times larger than the Axis. Please note that only a selection of countries are included in the table. The distribution of values into alliances is described in the previous notes.
Table data source: Harrison, Mark, "The Economics of World War II: Six Great Powers in International Comparison", Cambridge University Press (1998).
Summary of production

System                              Allies        Axis
Tanks and SP guns                  227,235      52,345
Artillery                          914,682     180,141
Mortars                            657,318     100,000+
Machineguns                      4,744,484   1,058,863
Military trucks                  3,060,354     594,859
Military aircraft total            633,072     278,795
Fighter aircraft                   212,459      90,684
Attack aircraft                     37,549      12,539
Bomber aircraft                    153,615      35,415
Reconnaissance aircraft              7,885      13,033
Transport aircraft                  43,045       5,657
Training aircraft                   93,578      28,516
Aircraft carriers                      155          16
Battleships                             13           7
Cruisers                                82          15
Destroyers                             814          86
Convoy escorts                       1,102           -
Submarines                             422       1,337
Merchant shipping tonnage       33,993,230   5,000,000+
Note that most Battleships and Cruisers were produced before the war and many served through its entirity.
Production by country
Vehicles and ground weapons
Tanks and self-propelled guns
- Soviet Union = 105,251 (92,595)
- United States = 88,410 (71,067)
- Germany = 46,857 (37,794)
- United Kingdom = 27,896
- Canada = 5,678
- Japan = 2,515
- Italy = 2,473
- Hungary = 500
Note: Number in parenthesis equals the number of tanks and self-propelled guns equipped with main weapons of 75 mm calibre or larger. Smaller producing countries do not have this differentiation.
Artillery
Artillery includes anti-aircraft and anti-tank weapons with calibres above 37 mm.
- Soviet Union = 516,648
- United States = 257,390
- Germany = 159,147
- United Kingdom = 124,877
- Japan = 13,350
- Canada = 10,552
- Italy = 7,200
- Other Commonwealth = 5,215
- Hungary = 447
Mortars (over 60 mm)
- Soviet Union = 200,300
- United States = 105,055
- United Kingdom = 102,950
- Germany = 73,484
- Commonwealth = 46,014
Machineguns
Machineguns do not include sub-machineguns, or machine guns used for arming aircraft.
- United States = 2,679,840
- Soviet Union = 1,477,400
- Germany = 674,280
- Japan = 380,000
- United Kingdom = 297,336
- Canada = 251,925
- Other Commonwealth = 37,983
- Hungary = 4,583
Military trucks
- United States = 2,382,311
- Canada = 815,729
- United Kingdom = 480,943
- Germany = 345,914
- Soviet Union = 197,100
- Japan = 165,945
- Italy = 83,000
Aircraft
Military aircraft of all types
- United States = 324,750
- Germany = 189,307
- Soviet Union = 157,261
- United Kingdom = 131,549
- Japan = 76,320
- Canada = 16,431
- Italy = 11,122
- Other Commonwealth = 3,081
- Hungary = 1,046
- Romania = 1,000
Fighter aircraft
- United States = 99,950
- Soviet Union = 63,087
- Germany = 55,727
- United Kingdom = 49,422
- Japan = 30,447
- Italy = 4,510
Attack aircraft
- Soviet Union = 37,549
- Germany = 12,539
Bomber aircraft

- United States = 97,810
- United Kingdom = 34,689
- Soviet Union = 21,116
- Germany = 18,235
- Japan = 15,117
- Italy = 2,063
Transport aircraft
- United States = 23,929
- Soviet Union = 17,332
- Germany = 3,079
- Japan = 2,110
- United Kingdom = 1,784[1]
- Italy = 468
Training aircraft
- United States = 57,623
- United Kingdom = 31,864
- Japan = 15,201
- Germany = 11,546
- Soviet Union = 4,061
- Italy = 1,769

Aircraft carriers
- United States = 22 (141)
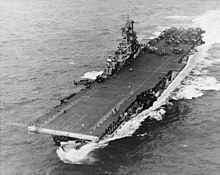
- Japan = 16
- United Kingdom = 14
- Germany = 0 None completed by the end of the war. Two were in production , Graf Zeppelin and Flugzeugträger B.
- Italy = 0 None completed by the end of the war. One was in production , see Aquila .
Figure in parentheses indicates merchant vessels converted to Escort carriers.
Battleships
- United States = 8
- United Kingdom = 5
- Italy = 3
- Japan = 2
- Germany = 2
Cruisers
- United States = 48
- United Kingdom = 32
- Japan = 9
- Italy = 6
- Soviet Union = 2
Destroyers
- United States = 349
- United Kingdom = 240
- Japan = 63
- Soviet Union = 25
- Germany = 17
- Italy = 6
Convoy escorts

- United States = 420
- United Kingdom = 413
- Canada = 191
- Germany = 23
Submarines
- Germany = 1,337
- United States = 422[citation needed]
- Japan = 167
- United Kingdom = 167
- Soviet Union = 52
- Italy = 28
Merchant tonnage
- United States = 33,993,230
- United Kingdom = 6,378,899
- Japan = 4,152,361
- Canada = 3,742,100
- Commonwealth = 2,702,943
- Italy = 469,606
Concrete bunkers and pillboxes
Estimate - uk only - 72,128,141 tonnes of steel and concrete [2]
Concreted runways
10,000,000 tonnes [3]
Materials
Coal
In millions of metric tons
- Germany = 2,420.3
- United States = 2,149.7
- United Kingdom = 1,441.2
- Soviet Union = 590.8
- Japan = 184.5
- Canada = 101.9
- Italy = 16.9
- Hungary = 6.6
- Romania = 1.6
Iron Ore
In millions of metric tons
- United States = 396.9
- Germany = 240.7
- United Kingdom = 119.3
- Soviet Union = 71.3
- Japan = 21.0
- Hungary = 14.1
- Romania = 10.8
- Italy = 4.4
- Canada = 3.6
Crude Oil
In millions of metric tonnes
- United States = 833.2
- Soviet Union = 110.6
- United Kingdom = 90.8
- Germany = 33.4 (including 23.4 synthetic)
- Romania = 25.0
- Canada = 8.4
- Japan = 5.2
- Hungary = 3.2
References
This article has an unclear citation style. |
- ^ By agreement, the UK drew most of its transport aircraft, excepting converted bombers, from the US allowing it to concentrate on production of bombers
- ^ File:War tonnages.xls An estimate of the rates of production carried out in WW2 as a guide to how quickly a crash programme of renewables could be built by comparison.
- ^ File:War tonnages.xls An estimate of the rates of production carried out in WW2 as a guide to how quickly a crash programme of renewables could be built by comparison.
- GDP values: Harrison, Mark, "The Economics of World War II: Six Great Powers in International Comparison", Cambridge University Press (1998).
- Milward, Alan S., "War, economy, and society, 1939-1945", University of California Press (1979).
- Overy, Richard, "Why the Allies Won (Paperback)", W. W. Norton & Company; Reprint edition (1997).
- Barnett, Correlli, "The audit of war : the illusion & reality of Britain as a great nation", Macmillan, (1986).
'Gross Domestic Product' 1940
See also
- World War II
- American tank production during World War II
- German tank production during World War II
- Soviet tank production during World War II
- WW2 aircraft production
- Italian aircraft production 1935 to 1945
- Rosie the Riveter
