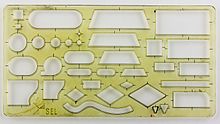
Flow chart
In organizational theory, a flowchart illustrates a workflow by prescribing a sequence of decisions and instructions . A symbol in the diagram usually corresponds to a state or a change of state, and a specific sequence corresponds to a path through the diagram. A flow chart usually contains optional paths and thus case-specific instructions.
In addition to the illustration of algorithms , flowcharts are suitable for representing processes and activities, for example for making decisions in repair instructions, for representing business models and in medical diagnostics.
There are different notations for flowcharts . The program schedule (PAP, also flowchart or flowchart) is widespread . Other examples are the Nassi-Shneiderman diagram or the Jackson diagram . Another related form of representation is the decision tree . Also UML offers different chart types that are suitable for the visualization of processes and activities.
Flow charts are related to graphical programming languages . While a flowchart is used to illustrate an algorithm, a graphic program can be executed on a computer.
