Program schedule
|
|
DIN 66001 |
|---|---|
| Area | Information processing |
| title | Symbols and their application |
| Latest edition | 1983 |
| ISO | 5807 |
A flow chart ( PAP ) is a flow chart for a computer program , also known as flow chart ( engl. Flow chart ) or program structure map is referred to. It is a graphic representation for the implementation of an algorithm in a program and describes the sequence of operations to solve a task.
The symbols for program flow charts are standardized according to DIN 66001 . Symbols for data flow plans are also defined there. Program flowcharts are often used independently of computer programs to represent processes and activities (e.g. as a description of the workflow when preparing offers in a trading company). In the area of software development, they are rarely used. Pseudocode offers a similar level of abstraction, but is easier to create and usually much easier to modify than a flowchart.
The concept of the program flowcharts, like the somewhat more recent Nassi-Shneiderman diagram (structured chart ), originates from the time of the imperative programming paradigm . When mapping object-oriented program concepts through UML , extended program flow charts ( activity diagrams ) are used.
elements
Mainly the following elements are used:
- 6.4.1: circle; Oval / rectangle with rounded corners: terminator
- 6.3.1: Arrow, line: Connection to the next element
- 6.1.1: Rectangle: Operation (activity)
- 7.2.4: Rectangle with double vertical lines: Execute the subroutine
- 6.1.3: Diamond: branch / decisions
- 6.2.1: Parallelogram: input and output (is defined in DIN 66001 of 1982, but should not be used for PAs)
example
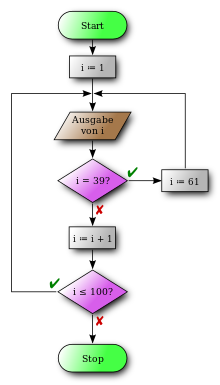
The illustration opposite shows a counting loop . The counter variable i is set to its starting value i = 1 before the loop begins. Then the first statement of the loop, the output of the variable i, is executed. The following second statement is a selection that checks whether i has the value 39. If this is the case, i is set to the value 61 and the loop begins with the next iteration . If i is not 39, i is increased by one in the following statement and then a check is made as to whether the loop continuation condition i≤100 is valid. If so, the loop is run through again. All natural numbers from 1 to 39 and 61 to 100 (both inclusive) would be output.
Creation

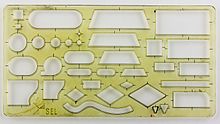
Program flowcharts were initially created manually, soon supported by special drawing templates .
Many graphics and office programs now offer templates for the simplified creation of program flow charts, supporting functions or special modules. Special programs often offer additional capabilities such as automatic disentangling (“making them free of intersections”) of arrows and connecting lines, or checking for correctness in accordance with DIN. Occasionally, flow charts can be generated automatically from pseudocode or from source code of a specific programming language , or conversely, the associated source code can be created in a specific programming language from a program flow chart.
literature
- Norbert von Bertoldi, Jutta Bayer: Professionally create program flow charts (PAPs) and structure diagrams: successfully solve commercial examination tasks. IWT-Verlag, Vaterstetten 1993, ISBN 3-88322-448-0 .
- Peter Stahlknecht, Ulrich Hasenkamp: Introduction to Business Information Systems , 12th edition, Springer Berlin / Heidelberg 2012, ISBN 3-540-77846-2
- Hans Westermayer: programming logic, program flow charts . Oldenbourg, Munich 1971, ISBN 3-486-38881-9 .
Web links
Individual evidence
- ↑ DIN 66001 - Symbols for data flow and program flow charts (Version from 1966) ( Memento from May 2, 2015 in the Internet Archive ) (PDF; 1.2 MB) from the Jena University of Applied Sciences
- ^ Symbols of the PAP according to DIN 66001 (1982) ( Memento of March 10, 2017 in the Internet Archive )


