Population development in Zwickau
This article shows the population development of Zwickau in tabular and graphical form.
Population development
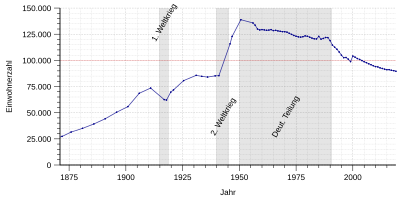
The population of Zwickau rose only slowly in the Middle Ages and the early modern period . Due to the numerous wars, epidemics and famines, it kept falling. When the plague broke out in 1472, over 1,600 people died, and in 1611 the plague claimed 1,100 deaths. As a result of the Thirty Years' War between 1618 and 1648, the population decreased significantly. In 1633 the plague hit Zwickau again. This time 1,900 people died. In 1682, the plague claimed over 1,000 lives. It was not until industrialization in the 19th century that population growth accelerated. While around 4,000 people lived in the city around 1800, by 1900 there were already 56,000.
The population of the city of Zwickau exceeded the limit of 100,000 on January 1, 1944, when Planitz (22,513 inhabitants in 1939) and Oberhohndorf were incorporated , making it a major city . Around 1950 the population reached its historic high of around 140,000.
Since the end of 1989 Zwickau has been affected by a sharp decline in the number of inhabitants. The city lost more than 25 percent of its population between 1990 and 2009, based on the current territorial status. Despite numerous incorporations of rural places in the 1990s - the area of the urban area increased by around 80 percent between 1992 and 2000 - the negative population trend could not be stopped, so that the population of the city fell below the number in 1998 and then again in October 2003 Limit of 100,000 fell.
The annual population decline between 2000 and 2008 averaged around 1,000 inhabitants. In population forecasts (as of 2006), the State Statistical Office of Saxony assumes that only between 82,000 and 85,000 people will live in the city in 2020 (based on the current area of 102.54 km 2 ).
On June 30, 2009, the “ official population ” of Zwickau was exactly 94,400 according to the state statistical office of the Free State of Saxony (only main residences and after comparison with the other state offices).
The following overview shows the number of inhabitants according to the respective territorial status. Up to 1800 these are mostly estimates, then census results (¹) or official updates from the city administration (until 1944), the state central administration for statistics (1945 to 1989) and the state statistical office (from 1990). From 1871, the information relates to the “local population”, from 1925 to the resident population and since 1966 to the “population at the place of the main residence”. Before 1871, the number of inhabitants was determined according to inconsistent survey procedures.
From 1470 to 1944
|
|
|
¹ census result
From 1945 to 1989
|
|
|
¹ census result
Source: State Central Administration for Statistics
Since 1990
|
|
|
Source: State Statistical Office of the Free State of Saxony
¹ Population extrapolation based on the census results from May 9, 2011
Population forecast
The Bertelsmann Foundation , Guide to Demographic Change , provides data on the development of the population of 2,959 municipalities in Germany (published January 2006). For Zwickau, a population decline of 11.6 percent (11,602 people) between 2003 and 2020 is predicted.
Absolute population development 2003–2020, forecast for Zwickau (main residences):
|
Source: Bertelsmann Foundation
Population structure
| population | As of June 30, 2007 |
|---|---|
| Eligible population | 99,695 |
| of which male | 48,059 |
| Female | 51,636 |
| Residents with main residence | 96,342 |
| of which male | 46.263 |
| Female | 50,079 |
| Residents with secondary residence | 3,353 |
| of which male | 1,796 |
| Female | 1,557 |
| Germans with main residence | 94,575 |
| of which male | 45.251 |
| Female | 49,324 |
| Foreigners with main residence | 1,767 |
| of which male | 1.012 |
| Female | 755 |
| Proportion of foreigners in percent | 1.83 |
Source: Office for Statistics and Elections of the City of Zwickau
age structure
The following overview shows the development of the total population and the individual age groups from 1990 to 2008. All data are from January 1st of each year.
| year | Total population | Age: 0-14 | Age: 15 to 64 | Age: from 65 |
|---|---|---|---|---|
| 1990 | 118.914 | 20,373 | 80,675 | 17,866 |
| 1991 | 115,434 | 19,818 | 77,755 | 17,861 |
| 1992 | 112,919 | 19,478 | 75.710 | 17,731 |
| 1993 | 110,583 | 18,540 | 74,435 | 17.608 |
| 1994 | 107,988 | 17,448 | 72,830 | 17,710 |
| 1995 | 104,921 | 16,064 | 70,871 | 17,986 |
| 1996 | 102,563 | 14,894 | 69,639 | 18,030 |
| 1997 | 102,752 | 14,222 | 70,080 | 18,450 |
| 1998 | 101.130 | 13,312 | 69,363 | 18,455 |
| 1999 | 105,365 | 13,294 | 72,531 | 19,540 |
| 2000 | 104,146 | 12,633 | 71,651 | 19,862 |
| 2001 | 103.008 | 12,027 | 70,723 | 20,258 |
| 2002 | 101,726 | 11,318 | 69,699 | 20,709 |
| 2003 | 100,892 | 10,658 | 69.106 | 21,128 |
| 2004 | 99,950 | 10.182 | 68.131 | 21,637 |
| 2005 | 98,954 | 9,759 | 66,900 | 22,295 |
| 2006 | 97.934 | 9,378 | 65,656 | 22,900 |
| 2007 | 95,841 | 9,169 | 62,650 | 24,022 |
| 2008 | 94,887 | 9,249 | 61.119 | 24,519 |
Source: Office for Statistics and Elections of the City of Zwickau
literature
- Imperial Statistical Office (Ed.): Statistical Yearbook for the German Empire , 1880–1918
- Statistisches Reichsamt (Ed.): Statistical yearbook for the German Reich , 1919–1941 / 42
- German Association of Cities (Ed.): Statistical Yearbook of German Communities , 1890 ff.
- State Central Administration for Statistics (Ed.): Statistical Yearbook of the German Democratic Republic , 1955–1989
Individual evidence
- ↑ State Statistical Office of the Free State of Saxony: Statistics - Population. "Population figures 2011 by municipalities - based on 2011 census [Download, *. Pdf, 0.06 MB]"; Retrieved January 26, 2018.
- ^ Database census 2011, Zwickau, city, age + gender


