
Hubbert linearization
The Hubbert linearization is a method for the presentation of production data of non-renewable resources in order to estimate two important parameters of a Hubbert curve ( logistic distribution ):
- the logistic growth rate and
- the total amount that will be funded.
The linearization technique was introduced by Marion King Hubbert in his 1982 review article. The Hubbert curve is the first derivative of the logistic function that was used to model the depletion of petroleum resources in particular, of finite mineral resources in general, and also to describe population growth.

principle
The first step in Hubbert's linearization is to plot the ratio of annual production P (e.g. bbl / a) to accumulated production Q (e.g. bbl) on the vertical axis and the accumulated production Q on the horizontal axis . This representation uses the linear property of the logistic differential equation:

With
- k as the logistic growth rate and
- URR (Ultimately Recoverable Resource) as the total recoverable amount.
Equation (1) can be reformulated as follows:

The above relationship is a straight line equation in the P / Q versus Q plane. Consequently, the regression line through the data points shows us an estimate for the straight line slope -k / URR and we can read off the parameters of the Hubbert curve from the intercepts:
- The parameter k is the point of intersection with the vertical axis.
- The URR value is the intersection with the horizontal axis.
Examples
Oil production worldwide
The geologist Kenneth S. Deffeyes applied the Hubbert linearization in 2005 to make a prediction about the peak of global oil production (late 2005), which, however, turned out to be premature. He did not distinguish between conventional and unconventional oil, which had not yet developed a long production history. In the 2010-2020 decade, hydraulic fracturing (tight oil) in the USA further increased global oil production. On the other hand, according to the BGR, conventional oil production has stagnated since 2005.
Oil production USA
The graphs below show an example of the application of Hubbert's linearization in the case of US oil production ( Lower 48 ). The regression line using the data points from 1956 to 2005 (in green) gives a URR value of approx. 200 Gb and a logistic growth rate of 6%.

Hubbert linearization of US oil production

Hubbert curve of US oil production

Oil production Norway
The Hubbert linearization for Norwegian oil fields (data status 2005) estimates the URR value at approx. 30 Gb and determines a logistic growth rate of k = 17%.

Hubbert linearization of oil production in Norway
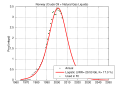
Hubbert curve for Norwegian oil production


Alternative methods
Second Hubbert linearization
The linearization principle can be extended to the first derivative of the production rate, i.e. H. the second derivative of the cumulative funding. For this purpose equation (2) is to be derived and one obtains:

The left term, the change in production as a percentage of current production, is often referred to as the rate of growth or decline. The curve of production change is a line that starts at + k, crosses zero at URR / 2 and ends at -k. In this way we can derive the parameters of the Hubbert curve from the regression degrees:
- The growth parameter k is the intercept on the vertical axis.
- The URR value is twice the intercept on the horizontal axis.
Hubbert's parabola
This diagram shows the delivery P as a function of the cumulative delivery Q. It is equation (2) multiplied by Q.

The parabola starts from the origin (0,0) and goes through (URR, 0). Data points through t are used with the least squares method to find an estimate for URR.
Logit transformation
David Rutledge applied the logit transformation to the analysis of production data for coal, which often has a worse signal-to-noise ratio than the production data for hydrocarbons. The integrative character of the cumulation serves as a low pass filter that filters out noise effects. The production data is fitted to the logistic curve after the transformation, using e (t) as the normalized exhaustion parameter , which ranges from 0 to 1.


The URR value is varied until the linearized logit fits best to a straight line with a maximum degree of determination .

Individual evidence
- ^ A b M. King Hubbert: Techniques of Prediction as Applied to the Production of Oil and Gas . proceedings of a symposium held at the Department of Commerce, Washington, DC, June 18-20, 1980. In: Saul I. Gass (Ed.): Oil and Gas Supply Modeling . NBS Special Publication 631. National Bureau of Standards, Washington (DC) 1982, p. 16–141 ( caltech.edu [PDF; 15.0 MB ; accessed on June 9, 2020]).
- ↑ Jon Claerbout, Francis Muir: Hubbert math . 2008. Accessed June 8, 2020.
- ↑ David Roper: Where Have All the Metals Gone? . Archived from the original on September 28, 2007.
- ^ David Roper: Projection of World Population . Archived from the original on February 18, 2007.
- ↑ Kenneth Deffeyes: Beyond Oil - The view from Hubbert's peak . Hill and Wang, New York 2005, ISBN 978-0-8090-2956-3 .
- ↑ C. Gaedicke, D. Franke, S. Ladage, R. Lutz, M. Pein, D. Rebscher, M. Schauer, S. Schmidt, G. von Goerne: BGR ENERGIESTUDIE 2019 (= data and developments of the German and global Power supply . Band 23 ). Federal Institute for Geosciences and Raw Materials, Hannover 2020, ISBN 978-3-9814108-3-9 , p. 43 ( bund.de [PDF; 8.5 MB ]): “Although global conventional oil production has stagnated since 2005, it remains the mainstay of the supply of liquid hydrocarbons in the long term with a share of around 75% of total production (Fig. 3-4). The increases in the total production of liquid hydrocarbons were primarily achieved through increased production of NGL, shale oil, oil sands production and biofuels. "
- ^ Sam Foucher, A Different Way to Perform the Hubbert Linearization . The Oil Drum . August 18, 2006. Accessed June 8, 2020.
- ↑ Canogar, Roberto: The Hubbert Parabola . GraphOilogy. September 6, 2006.
- ^ Rutledge, David: Estimating long-term world coal production with logit and probit transforms . In: International Journal of Coal Geology . tape 85 , no. 1 , January 1, 2011, p. 23-33 , doi : 10.1016 / j.coal.2010.10.012 .