JFreeChart
| JFreeChart
|
|
|---|---|
 Example column chart |
|
| Basic data
|
|
| Maintainer | David Gilbert |
| developer | Object Refinery Limited |
| Current version | 1.5.0 (November 5, 2017) |
| operating system | Java Runtime Environment |
| programming language | Java |
| category | Graphics software |
| License | LGPL |
| German speaking | No |
| jfree.org/jfreechart | |
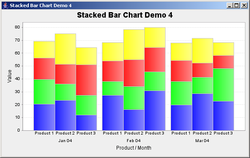
JFreeChart is a framework for the Java programming language with which complex diagrams can be created in a simple way . The software supports a variety of chart types, such as bar charts , bar charts , pie charts , Gantt charts and histograms . A simple export of the graphics as PNG or JPEG is also possible.
history
The JFreeChart project was started in 2000 by David Gilbert and is also led by him. But other developers have also made smaller contributions. The project is mainly financially supported by Object Refinery Limited, David Gilbert's company, which sells documentation and consulting related to JFreeChart to other companies. This means that the official website only lists the raw Javadocs and a few screenshots, and not easy-to-use code samples that are only delivered to paying customers.
use
The download figures are consistently over 20,000 per month, from SourceForge alone JFreeChart has been downloaded more than 3.5 million times. The API is used in several open source and commercial products; Well-known ones include JBoss and StatCVS on an open source basis, as well as JIRA Chart Plugin and NetBeans QA on a commercial basis.
Individual evidence
- ↑ The jfreechart Open Source Project on Open Hub: Languages Page . In: Open Hub . (accessed on July 18, 2018).
- ↑ Sourceforge: Download statistics for JFreeChart
- ^ JFreeChart: Third Party Products Incorporating JFreeChart
Web links
- Official website (English)