
Gantt chart

A Gantt diagram [ gænt ] or bar chart is a project management instrument named after Henry L. Gantt (1861–1919) , which graphically displays the chronological sequence of activities in the form of bars on a time axis. The bar chart was invented by Joseph Priestley (1733–1804). The bar plan was first used in project management by Hermann Schürch (1881–1957), who called this methodical approach the construction program .
Structure and structure
In the Gantt diagram, the activities of a project are entered in the first column of a table. The time axis is shown in the first line of the table. The individual activities are then visualized in the respective lines with a horizontal bar. The longer the bar, the longer the activity lasts. Overlapping activities are shown by overlapping bars. The visualization of the critical path is also possible. Often arrows are used to illustrate the dependencies between the activities. If there is a large number of activities, the display can quickly become confusing. The Gantt chart is therefore more suitable for projects with a small to medium number of activities.
One challenge lies in choosing the right level of detail. Too small a number of activities or only the representation of sub-projects does not allow sufficient control of the activities. Taking up every single activity weakens the meaningfulness. The grouping of activities into project phases makes the Gantt chart much clearer.
Advantages and disadvantages
Compared to the network plan , a Gantt chart offers several advantages. The duration of the activities is visibly shown by the length of the bar, and end-start relationships can also be set in the course of an activity. In addition, the training and creation effort compared to a network plan is relatively low, since Gantt diagrams can be interpreted intuitively. You can also easily compare several projects with one another.
The disadvantage of the Gantt diagram is that, unlike the network plan, it can only be used to display the dependencies between activities on a time-related basis. For this purpose, buffer times are usually not marked.
Gantt charts are therefore particularly suitable for smaller projects or for a simple visualization of the duration and time course of the projects.
Other possible uses
In production management , Gantt charts are used as an instrument for production planning and control and are referred to as machine utilization plans or order diagrams .
Technically, the difference in the occupancy plan is that it is not the resources that are assigned to the phases, as is the case with project planning, but rather the tasks are assigned to the resources (the scarce resources therefore have an effect on the scheduling). Machine occupancy plans contain the machines in the first column, so that occupancy and downtimes of resources or waiting times of tasks can be read off. However, the overview of the order progress can quickly be lost here. In the order (sequence) diagram, the orders are in the first column, so that order progress and processing times can be read. Both types of representation are different perspectives on the same planning problem.
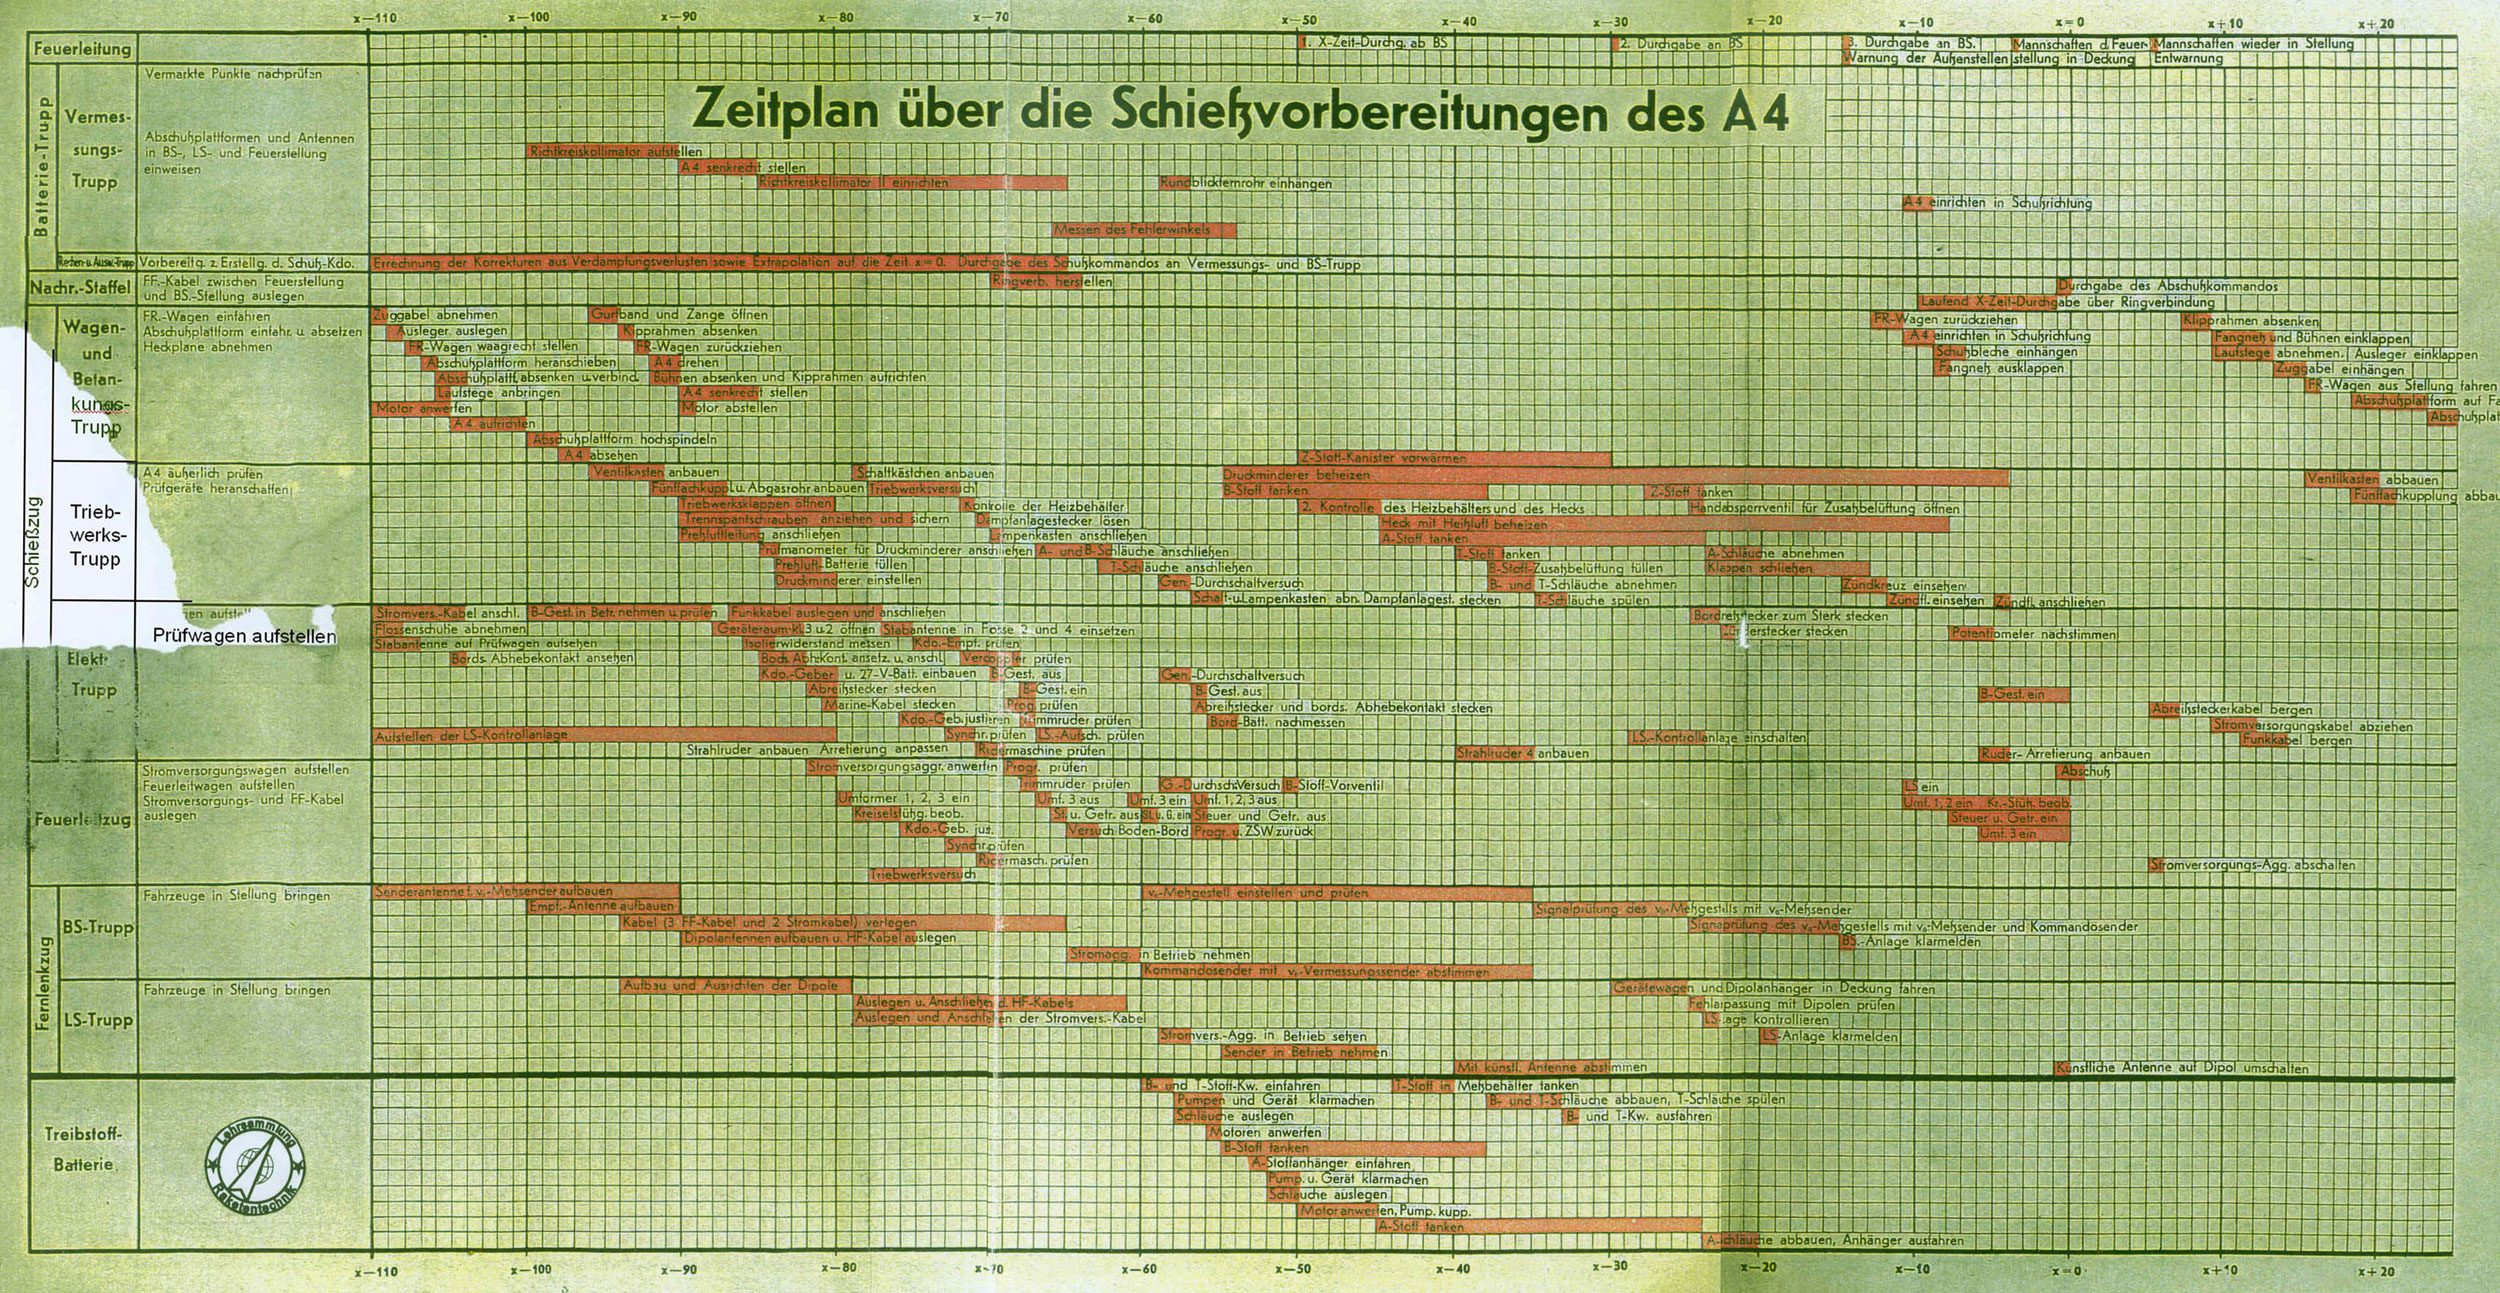
The work in the course of a countdown can also be displayed using a Gantt diagram.
software
Numerous programs are available for creating Gantt charts. The following is a selection of application programs that can display Gantt charts:
Free software:
- Dojo Toolkit - dojox / gantt
- dotProject
- GanttProject
- Open Workbench
- PH project
- ProjectLibre
- Redmine
- TaskJuggler
- OpenProj
- OpenProject
Paid license:
- A plan
- ACOS Plus 1
- BRZ 7 - Construction time planning module
- FastTrack Schedule
- Genius Project
- InLoox
- in-STEP BLUE
- Merlin (software)
- Microsoft Project
- Microsoft Visio
- MindManager
- PLANTA Project
- Plant simulation
- Projektron BCS
- Wrike
- Zenkit
- XDEV BI Suite (add-on for XDEV 4 IDE)
- onepoint PROJECTS
Web links
Individual evidence
- ^ Hermann Schürch: The construction of the valley crossing at Langwies on the Chur-Arosa electric railway . In: Reinforced Concrete: Monthly magazine for theory and practice of the entire concrete construction . tape VIII , no. 10 . Springer, Berlin 1915, p. 233 .
- ↑ Schedule of the preparations for firing the A4. Context: Operation Backfire Tests at Altenwalde / Cuxhaven. In: http://www.v2rocket.com/start/chapters/backfire.html . T. Dungan, accessed February 2, 2018 .