Multi-moment study
The multi-moment frequency study ( MMH ) is defined as a heuristic sampling procedure that allows statistically secured statements about the temporal structure of any processes. The multi-moment frequency study is therefore a method for obtaining information directly through observations at time intervals. The significance of the results obtained is assessed using statistics . The assessment of the probabilities is carried out with the help of stochastics ( probability calculation ).
The method is said to have been used for the first time in England in 1927 by Leonard HC Tippett . The term multi-moment was coined in 1954 by the Dutch engineer Gerdien de Jong . In the English literature the procedure is described as " Work Sampling ", in the French as " Observations Instantanées "
In order to determine which activities the employees of an organization pursue day in and day out, you could question them yourself or observe them permanently (New German: DILO - Day in the life of ... ). Complete observation, for example in the context of a REFA distribution time recording , would not only be problematic for reasons of data protection, it would also be very expensive. The multi-moment study provides statistically reliable statements on the distribution of activities with less effort. In this way, statements can be made, for example, that an employee spends around 30% of his working time copying if this employee was observed correspondingly often at the various observation times during that activity.
Advantages and disadvantages
The advantages of the multi-moment study are primarily the comparatively lower effort compared to a full survey , the flexibility, the variable accuracy of the results, a high degree of adaptability and the fast evaluability of the data. In addition, no personal data is created and the recording can be interrupted at any time and continued at a later point in time. The disadvantage is that the results show the statistical uncertainties and no causes for the observations obtained can be determined. If, for example, a multi-moment study shows only 50% production work at the end, the question “Why only so little?” Cannot be answered from the study.
Mental activities cannot be observed by outsiders. A variant of the MMH, the multi-moment self-recording, can be used here. There is also PDA- compatible, relevant software on offer. The PDA reports at random intervals, and the respective employee then taps on the type of procedure he has just performed. The PDAs are read out by the study management and the data is evaluated at reasonable intervals . Plausibility checks and additional statistical tests can provide information as to whether participants in the study are “cheating”. Overall, the influence of knowingly incorrect entries can also be compensated for by a significantly increased scope of observation compared to an externally observed MMH study.
The disadvantage of self-recording is the following: A conventional MMH does not generate any personal data. The type of process observed in a person is represented by a line; a date which person was observed does not even arise. This makes it easy for most works councils to approve an MMH. With this personal independence it is a thing of the past with self-recording with PDAs . On the contrary: plausibility checks of the transferred data require that they are personal at least up to this point in time when the data is processed. This makes it much more difficult to implement such a study operationally.
Action
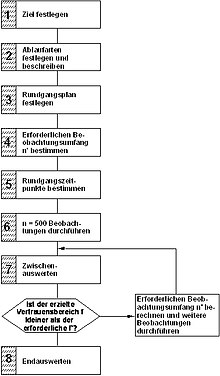
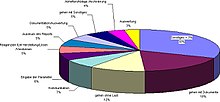
A multi-snapshot runs according to the eight-stage scheme shown in the REFA standard program multi -snapshot. An example of a result is shown in the next picture for a chemical quality control laboratory.
1. Set a goal
As with any data discovery , the first thing to do is formulate the goal of the multi-snapshot. In this case, this goes hand in hand with the definition of the underlying workplaces and the people and equipment to be recorded. Exemplary goals are the determination of (time) shares for certain types of processes in the overall process or the degree of employment of employees and resources.
A particular advantage of the multi-moment frequency method is that the recording can be interrupted at any time in the event of unusual events that would falsify the result and then continued when "normal" conditions prevail again. In this context, it is also true that the study should take place at “normal” times (no vacation or flu epidemic) - that is, it makes sense from February to April (before Easter) or September to mid-December.
2. Define and describe process types
It is to be determined which types of processes are relevant for the investigation. The condition is that these types of processes can be clearly identified through brief observation. You should also limit yourself to a few types of process, as each additional type of process increases the required scope of observation disproportionately. On the other hand, the types of processes must be selected and described in such a way that all possible observable processes can also be recorded.
In practice, you can help yourself by subdividing each type of process more precisely and sorting it locally on the observation sheet. For example, the process type “production work” in a chemical company could be listed on the tour sheet as “set valves”, “fill containers” and “weigh-in” etc. The observer can tick what he sees without having to think about which one This observation is to be assigned to the process type. This significantly increases the reliability of the recording.
3. Define the tour plan
The tour routes and the observation points are determined and outlined in a tour plan. An observation point is the spatially marked point from which observation is to take place at the moment of passing.
4. Determine the number of observations
The number of necessary observations (sample size) depends on the required absolute confidence interval f 'of the results. This value specifies an interval (in% of the numerical value obtained) in which the actual value can be removed from the value determined in the multi-snapshot (given an additionally given confidence level, usually 0.95). Again: With a confidence level of 0.95 and an f 'of 2%, the actual value with a probability of 0.95 is no further than ± 2% from the one determined in the multi-moment study. If this were 100, the real value is with a probability of 0.95 not less than 98 and not greater than 102 - with a probability of 0.05 it is.
The presumably required number of observations n 'depends - given a given level of confidence - on the desired accuracy f' and the proportional value p of the individual types of process . The greater the proportion of an interesting process type in the overall process, the higher the number of necessary observations. The value n 'is therefore not determined for the smallest type of process expected at all, but for the one that is primarily of interest. On the basis of a confidence level of 0.95, the following applies:
REFA has published a nomogram that can be used as a practical aid for forming the sample . The smaller the value of f ', the more observations are required for a certain proportional value p. Therefore, excessive accuracy should not be required.
The number of required tours results from the absolute number of necessary observations n and from the number of observations possible per tour. The more observations per tour, the fewer tours are required - provided that the same facts are observed at each point. Otherwise, the observations made only apply to this observation point, and the individual points of a tour then mark observation points of different, parallel multi-snapshots.
5. Determine tour times
The times for the individual tours must be chosen randomly so that the statistical conditions are sufficient and an unconscious influence on the results by the observer is excluded.
First of all, it is determined how many observations should be made per day. These mainly depend on how often the respective process types change. If they change quickly, many observations can be provided, if they change rarely, observations may only be made less frequently. Other influencing factors on the frequency of tours are its duration, the planned duration of the multi-moment study itself and the number of observers that can be used.
6. Perform the first 500 observations
The tours are set out in a tour plan. The times of the tour are to be determined at random, taking working hours and breaks into account. The types of processes found at the observation points are simply ticked. If the type of process changes during an observation, the one that was detected when it arrived is noted. If several are observed at the same time, the one noticed first applies.
Before starting the actual multi-snapshot, test tours should be used to check whether each observer correctly notes every feature. The observers can also familiarize themselves with the recording technology. In addition, the observation sheet can be checked again for completeness and practicability.
7. Intermediate evaluation
With an increasing number of observations, there is a distribution of the frequencies of the types of process observed, which increasingly approximates the real distribution, and the confidence range becomes ever narrower. After around 500 observations, a suitable time has usually come for an interim evaluation, in which the originally estimated distribution is replaced by the now approximately determined distribution. It is checked whether the originally planned number of necessary observations is sufficient to achieve the desired accuracy or whether the study can even be shortened.
The new values can also be taken from the REFA nomogram - in reverse order. Mathematically, the following formula applies to the determination of the achieved accuracy f (n: number of available observations, p: the proportional value determined for the type of process):
8. Final evaluation
The final evaluation essentially follows the procedure of the intermediate evaluation. If a powerful spreadsheet is used , a continuously expanded interim evaluation at the end of the study can immediately be the final evaluation.
In practice, it is advisable to also record the locations and times of observations on the observation sheets. This allows the questions to be varied after the exposure. For example, does the distribution of activities change over the course of the day or are there activities that accumulate in certain (unexpected) locations?
literature
- Haller-Wedel, Ernst: The multi-moment method in theory and practice: a statistical method for the investigation of processes in industry, economy and administration 2nd edition Munich: Hanser, 1969 - ISBN 3-446-10543-3 .
- Gerlach, Horst; Heinz, Klaus; Simons, Bernard: The multi-moment timing method: Basics and application. Cologne: TÜV, 1987 - ISBN 3-88585-401-5 .
- Grap, Rolf: Production and Procurement: A Practice-Oriented Introduction. Munich: Vahlen, 1998 - ISBN 978-3-8006-2321-1 . Pp. 205-213.
- REFA - Association for Work Studies and Business Organization e. V. (Hrsg.): Data determination: Methodology of work studies, part 2. 6th edition Munich: Hanser, 1978 - ISBN 3-446-12704-6 .
- Schmidt, Götz: Method and Techniques of Organization. Gießen: Schmidt, 2001 - ISBN 3-921313-62-7 .
- Pock, Erwin: The multi-moment study as a method of obtaining information for structuring processes over time. Vienna: Association d. Scientific Societies of Austria, 1974 (dissertation).
- Manfred Schulte-Zurhausen : Organization. 4th edition Munich: Vahlen, 2005 - ISBN 3-8006-3205-5 .
- REFA - Association for Work Design, Business Organization and Business Development eV: "Methodology of business organization: data determination." Munich: Hanser, 1997 - ISBN 3-446-19059-7
Individual evidence
- ^ Tippett, Leonard HC: Use of the Binomial and Poisson Distribution: A Snap Reading Method of Making Time Studies of Machines and Operations in Factory Surveys. In: Shirley Institute Memoirs 13 (1934) 11, pp. 35-93. Quoted from: Brisley, Chester L .: Work Sampling and Group Timing Technique. In: Zandin, Kjell B .: Maynard's Industrial Engineering Handbook. 5th ed. New York: McGraw-Hill, 2001. - ISBN 0-07-041102-6 . Pp. 17.47-17.64.


