Tanabe-Sugano diagram
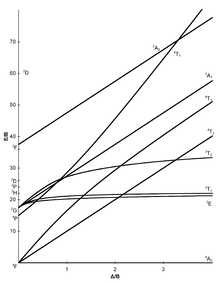
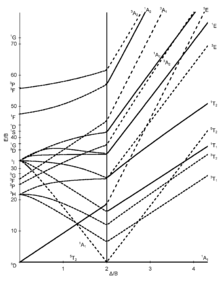
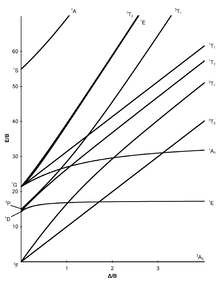
The Tanabe-Sugano diagram - named after Yukito Tanabe and Satoru Sugano - is a diagram in which, for all electronic states of an octahedral system, the energy difference E to the (typically) lowest state is plotted against the crystal field splitting energy , both quantities normalized the Racah parameter B . In contrast to the organ diagram , quantitative statements can be made with the Tanabe-Sugano diagram.
The number of curves which are intersected by a vertical line of a given gives the number of possible transitions and thus the number of expected absorption characteristics. The Tanabe-Sugano diagram is thus a correlation sdiagramm which the interpretation of absorption spectra allows chemical compounds.
The following fine structure splitting can be observed:
| term | Split in oct. field |
|---|---|
| S. | A 1g |
| P | T 1g |
| D. | E g , T 2g |
| F. | A 2g , T 2g , T 1g |
| G | A 1g , E g , T 2g , T 1g |
| H | E g , T 1g , T 1g , T 2g |
| I. | A 1g , A 2g , E g , T 1g , T 2g , T 2g |
Tanabe-Sugano diagrams
The seven Tanabe-Sugano diagrams for octahedral complexes:
The diagrams for the d 1 , d 9 and d 10 electron configurations are not needed.
d 1 system
In a d 1 system there is no electron repulsion, so the electron remains in the ground state of the t 2g orbital. The term symbol for this system is 2 D; 2 D splits into the 2 T 2g and 2 E g states. Only one absorption band can be found in the UV-Vis spectrum of a d 1 ion, namely that for the transition from 2 T 2g to 2 E g .
d9 system
Like the d 1 system, the d 9 system has a 2 D term. The excitation takes place here from the (t 2g ) 6 (e g ) 3 configuration ( 2 E g state) to the (t 2g ) 5 (e g ) 4 configuration ( 2 T 2g state).
d 10 system
There are no dd transitions in d 10 metal complexes, so no UV-Vis absorption bands can be observed and a Tanabe-Sugano diagram does not exist.
Tetrahedral complex geometry
In general, no Tanabe-Sugano diagrams are created for tetrahedral complexes. This is because a Tanabe-Sugano diagram for a d n tetrahedron is similar to that of a d (10 − n) octahedron. Since the ligand field splitting in the tetrahedral complex is only 4/9 of that of the octahedron, with a few exceptions, only high-spin complexes are found and therefore the right low-spin sides in the Tanabe-Sugano diagram for tetrahedral complexes can be neglected.
Using the diagrams
- The d-electron configuration of the ion has to be determined.
- The Tanabe-Sugano diagram suitable for the d-electron configuration must be selected.
- The maximum of the absorption has to be found in a UV-Vis spectrum. Spin-allowed transitions will be more intense than the spin-forbidden transitions.
- The absorption maxima have to be converted into wave numbers and the ratios of the wave numbers to the lowest have to be determined.
- Now the diagram can be examined from left to right until the transitions are in the calculated relationship to one another.
- The E / B and / B values can now be read.
Examples for quantitative evaluation
Hexaquamangane (II) - [Mn (H 2 O) 6 ] 2+
Manganese occurs in the +2 oxidation state in the [Mn (H 2 O) 6 ] 2+ complex , which is why it is an octahedral d 5 ion. Since water is a weak-field ligand (see spectrochemical series ), the basic term in the Tanabe-Sugano diagram is 6 A 1. Since there is no further sextet state in the Tanabe-Sugano diagram, no spin-permitted transition is possible. The absorptions observed will therefore be of low intensity.
Nevertheless, the ratio of all measured wave numbers to the lowest could now be determined. This ratio can then be used to search for suitable transitions in the d 5 -Tanabe-Sugano diagram (at 1 or 2 Δ / B), and when this is found, the E / B values (y-axis) can be read off. Δ oct then results from:
Approximately the same B or Δ oct value should result for all transitions .
See also
Source
- Catherine E. Housecroft and Alan G. Sharpe: Inorganic Chemistry . 2nd updated edition, Pearson Studium, Munich 2006, ISBN 978-3-8273-7192-8 .
Individual evidence
- ^ CE Housecroft; Sharpe AG: Inorganic Chemistry . 4th ed. Pearson, Harlow, England 2012, ISBN 978-0-273-74275-3 , pp. 691 .


